
Botanical Gardens, Auckland, New Zealand
US Equities returned to their sideways consolidation mode this week:
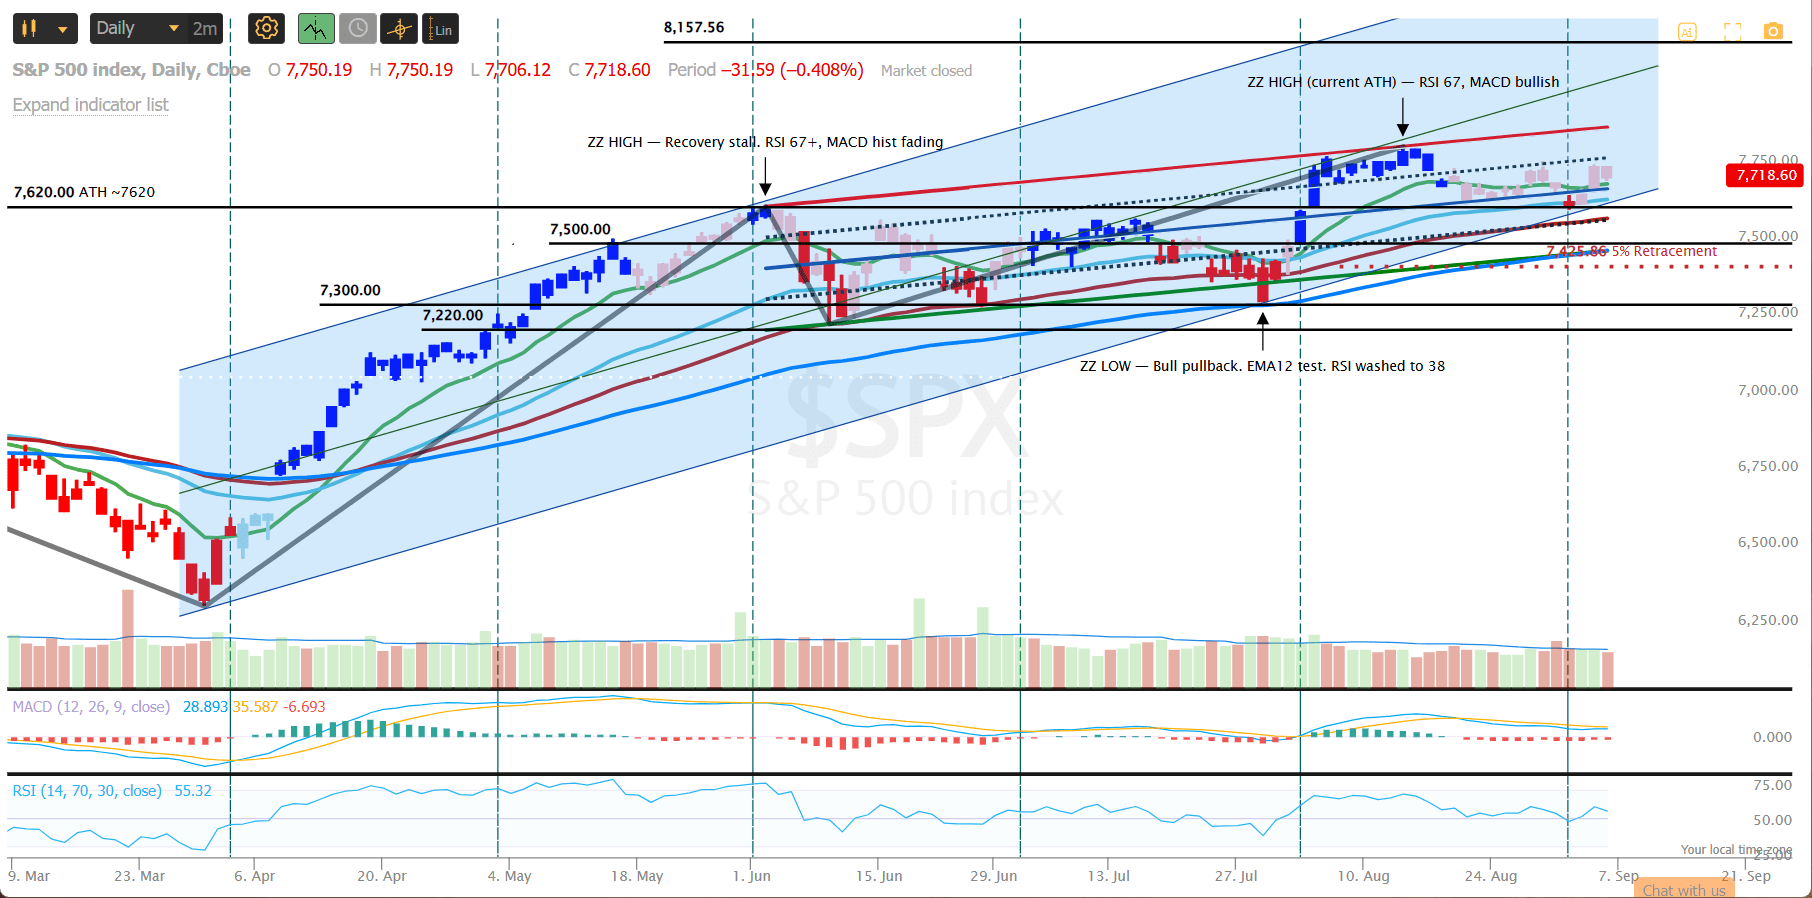 closing only slightly (0.1%) higher than last week’s close. We remain in a bullish uptrend channel but are sitting at the bottom of the channel as we wait to see whether the trend continues or whether we fall out of the channel and see a pullback/correction. To date the ~7620 level has acted as effective support.
Compared to other major asset classes:
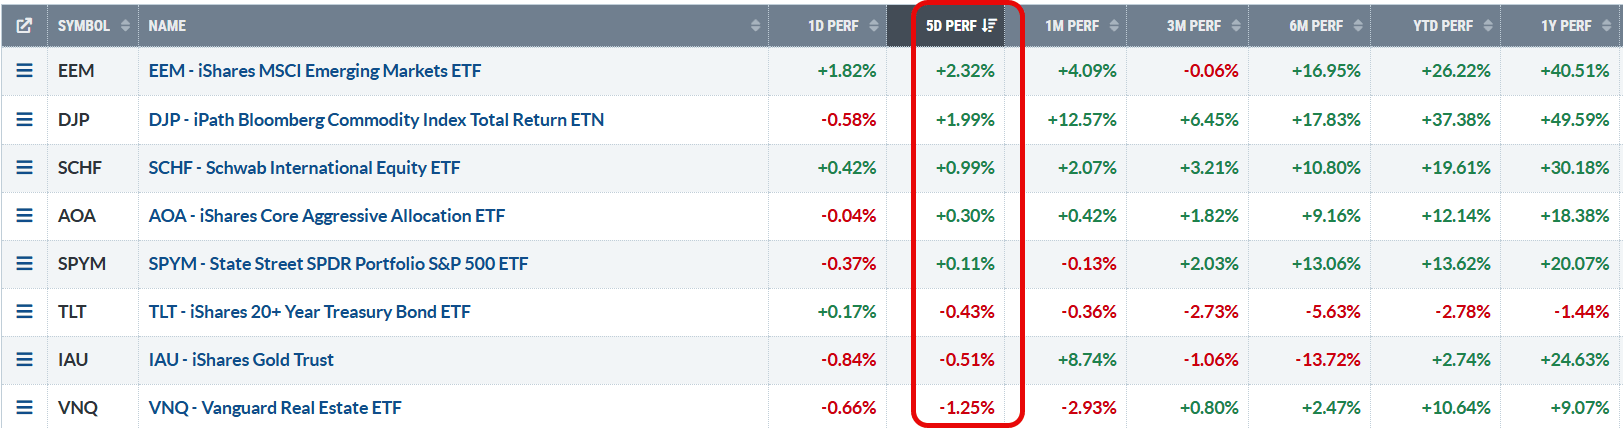 US equities fall in the middle this week with International Equities and Commodities (Oil) outpacing them.
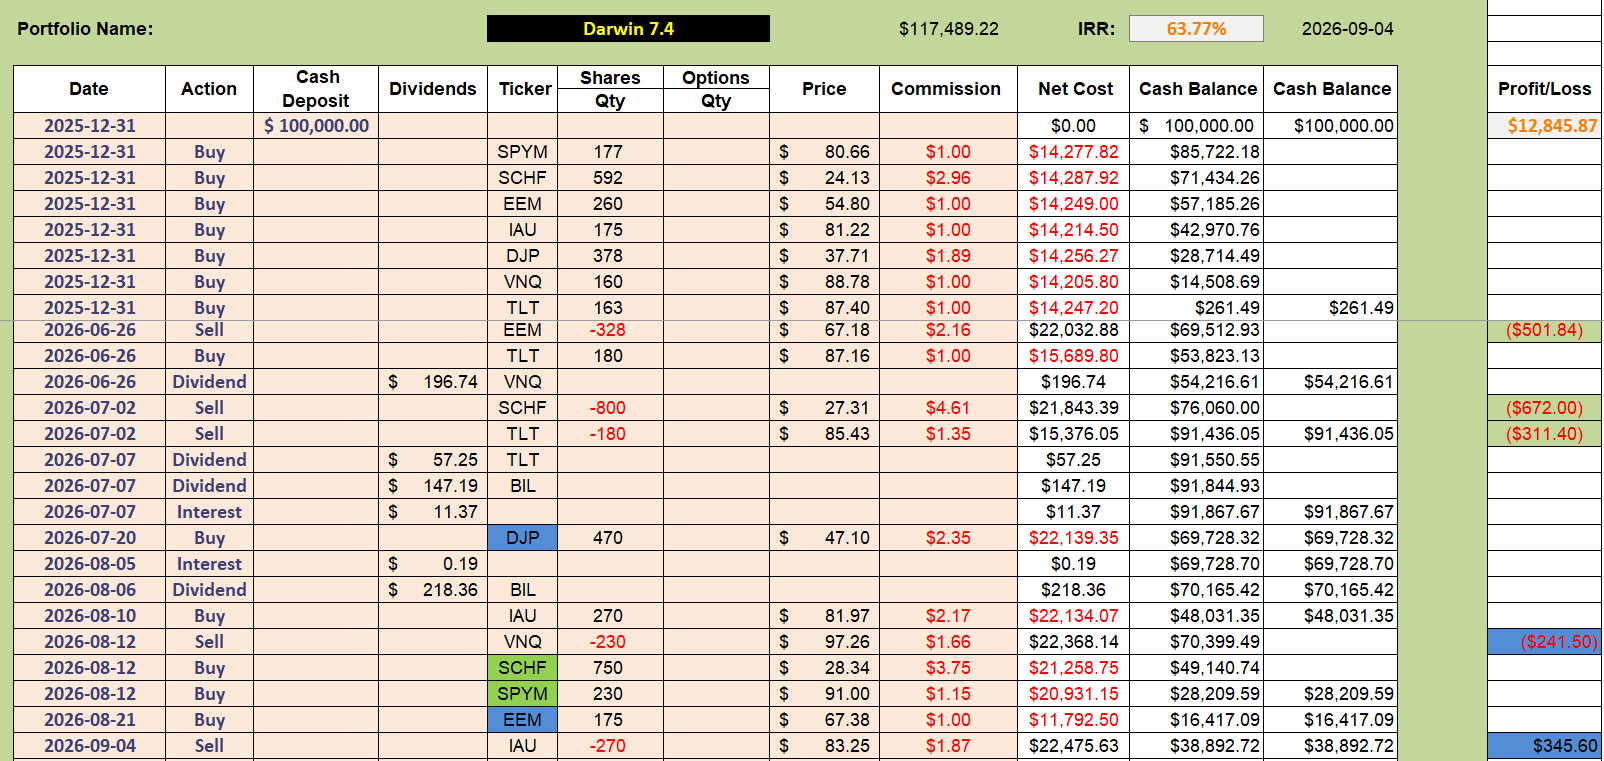
Checking the Darwin Porfolio analysis sheet:
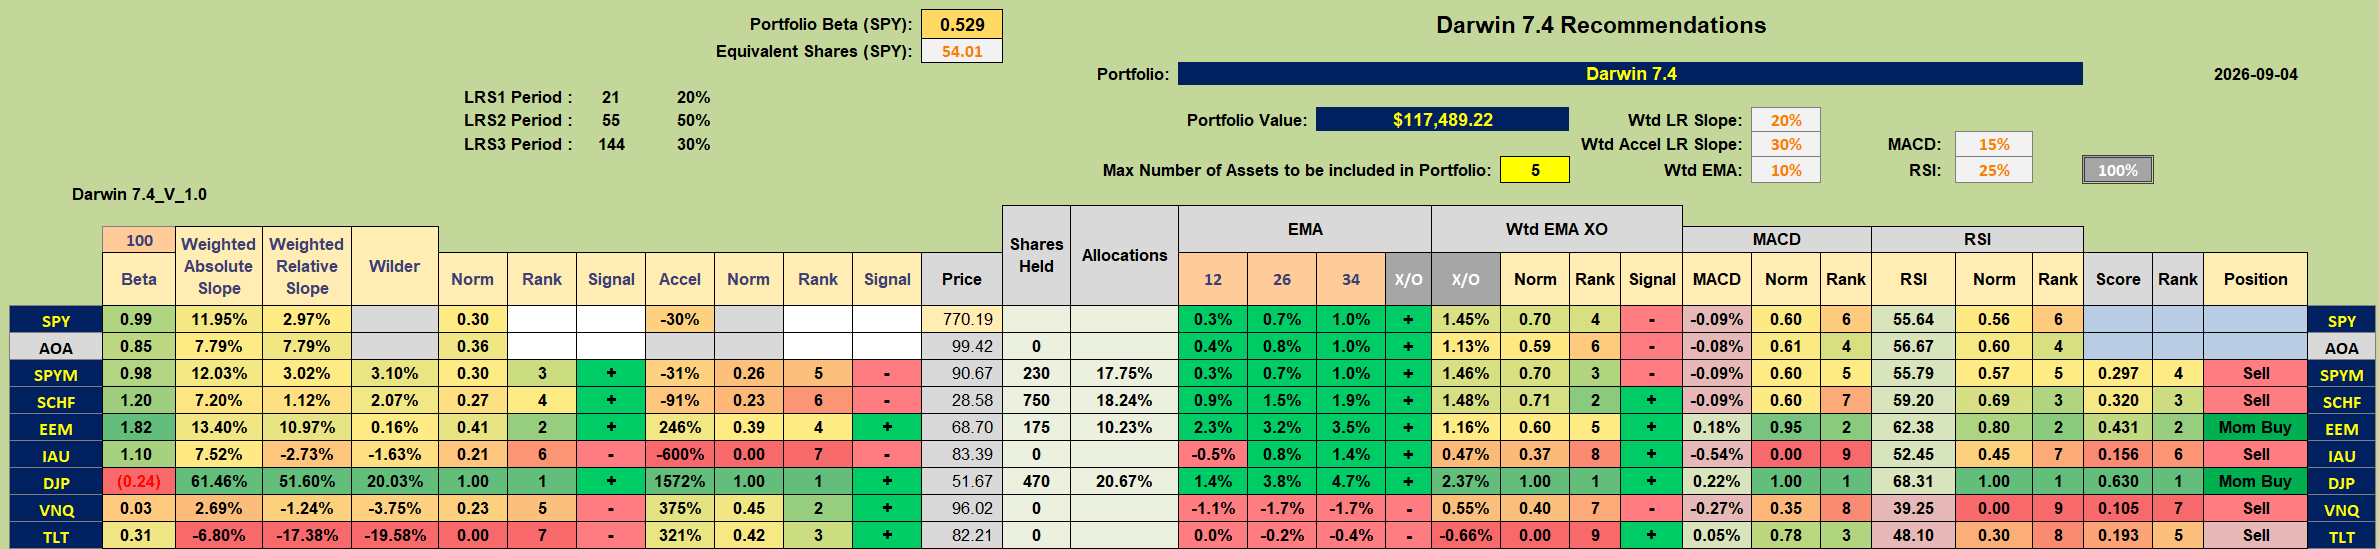 we see that three of the ETFs that were held (SPYM, SCHF and IAU) have generated Sell recommendations. So let’s take a look at the charts to see what is happening:
The momentum/acceleration graphs for IAU (Gold) look like this:
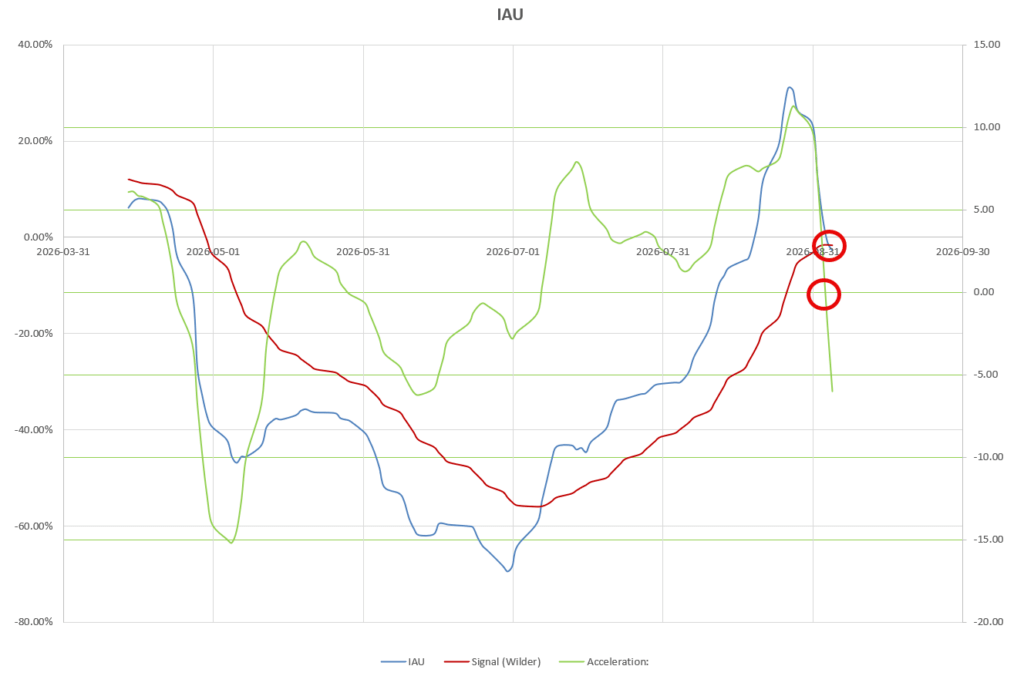 where we see that acceleration (green line) has dropped quickly below zero and into negative territory whilst momentum (blue line) has just dropped below it’s 14-period Moving Average (trigger) and also into negative relative momentum territory. Short term indicators are mixxed with a negative signal for MACD (Moving Average Convergence/Divergence) and a positive signal for RSI (Relative Strength Index).
As a final check we can look at the price chart:
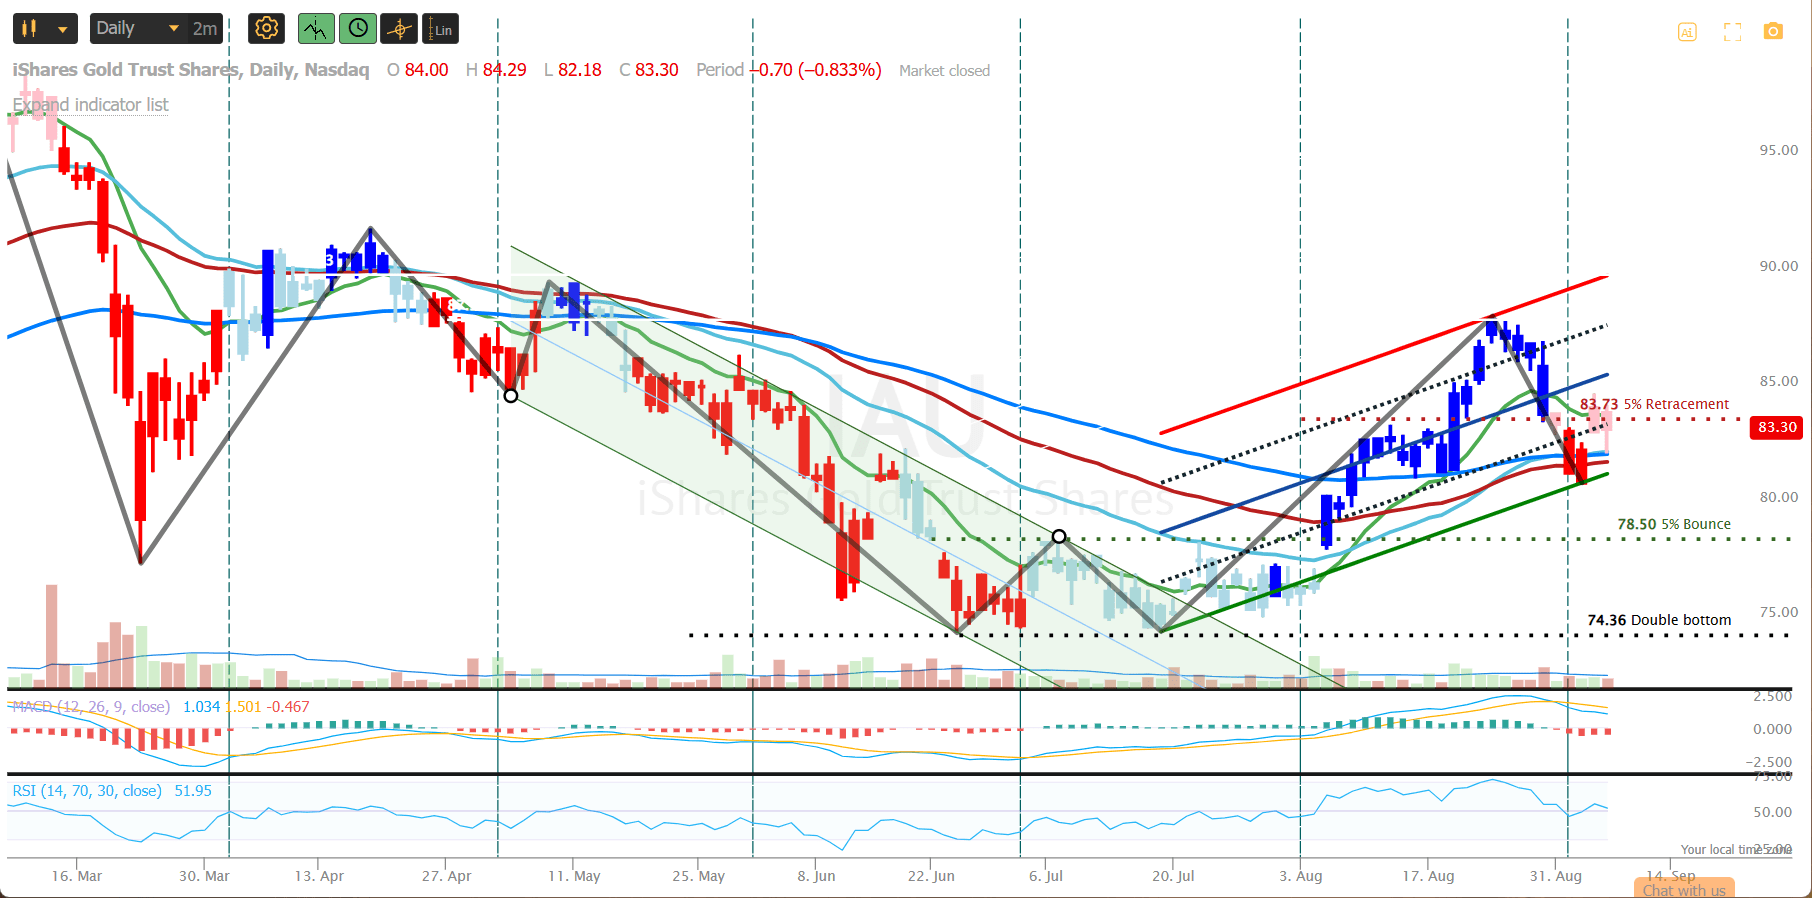 where, although we have broken out of the May-July bearish channel we have now dropped back ~5% from the August highs and are currently sitting near the bottom of a weakly defined uptrend channel. At this point I decided to close out the existing position in IAU at a small (~$345) profit and to look for clearer evidence of future direction:
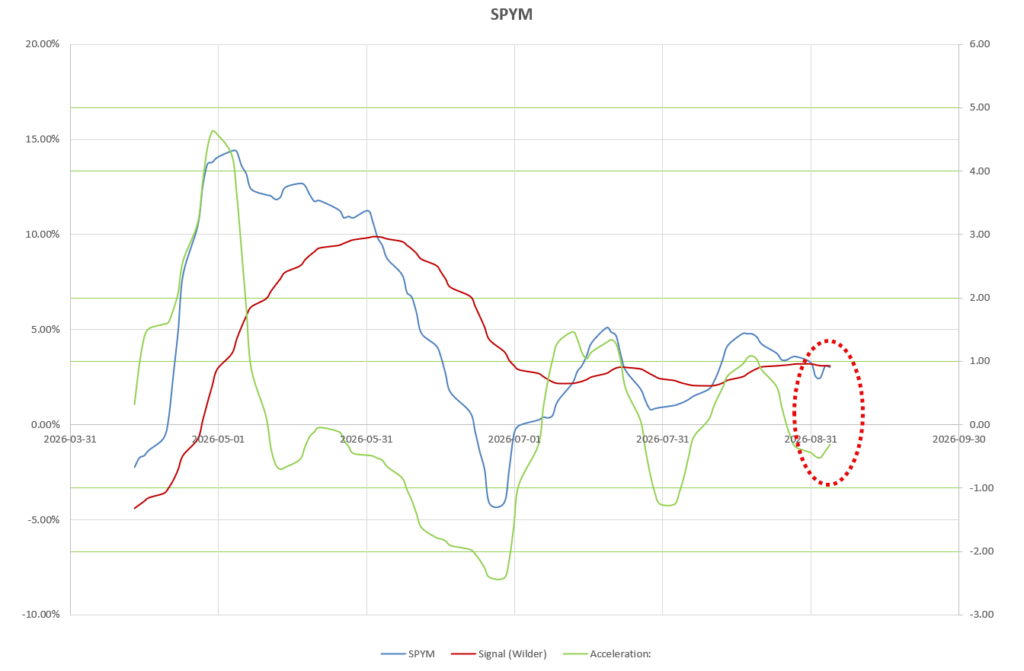
 The equity markets look a little different – with Emerging Markets (EEM) still looking strong, but US Equities (SPYM) in potential whipsaw territory with negative, but reversing, acceleration and momentum oscillating around it’s Wilder moveng average.
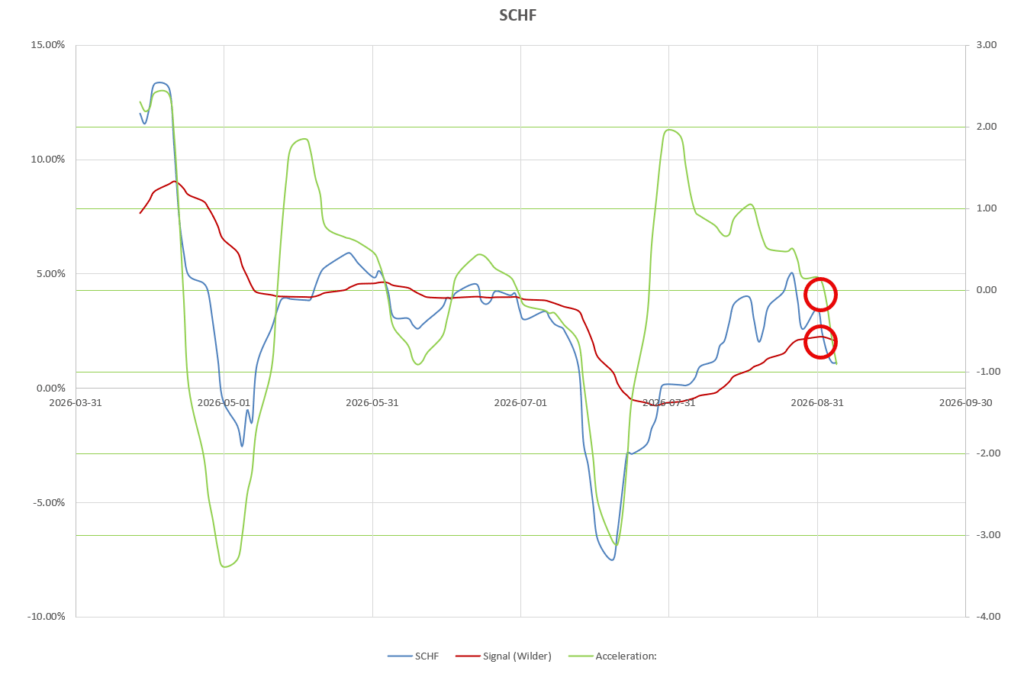
 Developed Market Equities (SCHF) are showing almost the opposite behaviour – although still typical of consolidating sideways markets:
 The price chart for SPYM is virtually the same as for the SPX Index above with SCHF showing a similar pattern near the centre of a bullish uptrend channel:
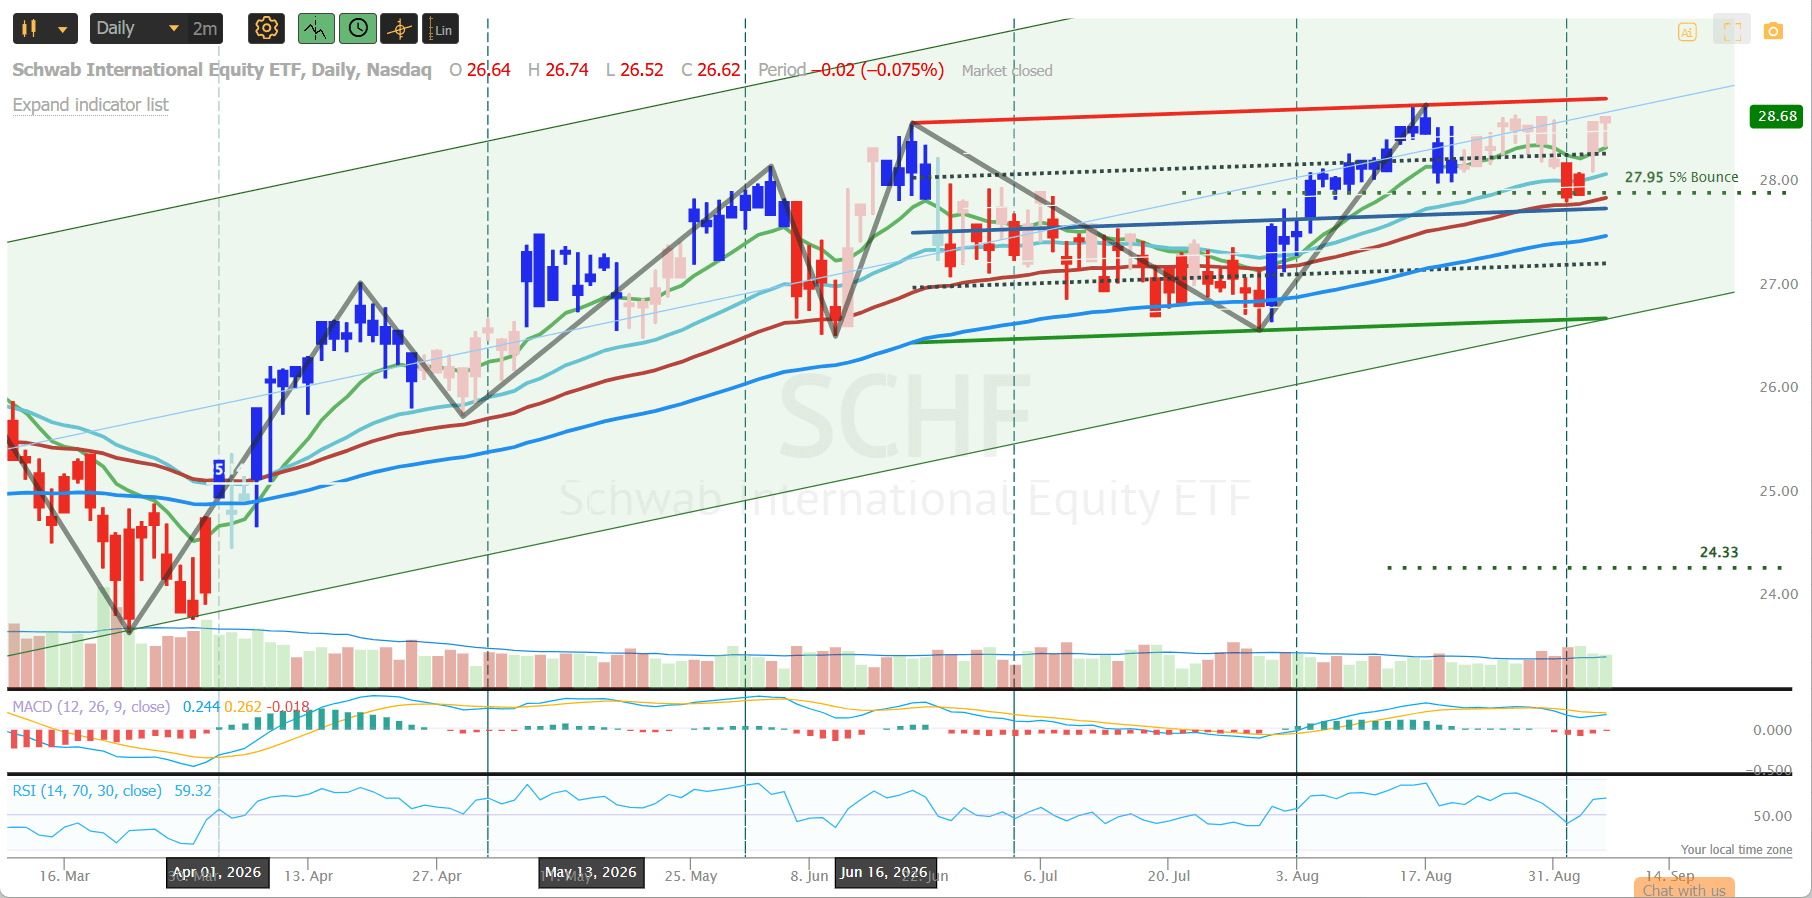 I have therefore chosen to hold my existing positions in these 2 ETFs and to monitor the charts for evidence of a (bullish or bearish) breakout from the sideways channel..
Performance of the portfolio to date looks like this:
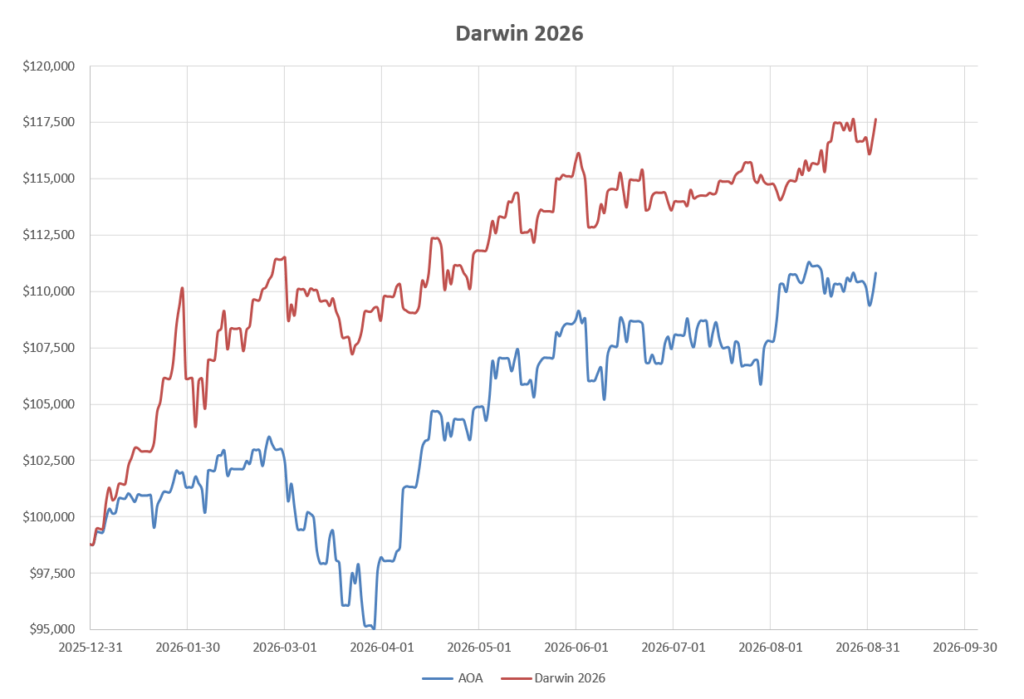 still well ahead of it’s benchmark AOA Fund and at it’s yearly high with a ~27% Internal Rate of Return (IRR) over the eight month period.
Discover more from ITA Wealth Management
Subscribe to get the latest posts sent to your email.
Leave a Comment or Question