
Brooks Wine Vineyard
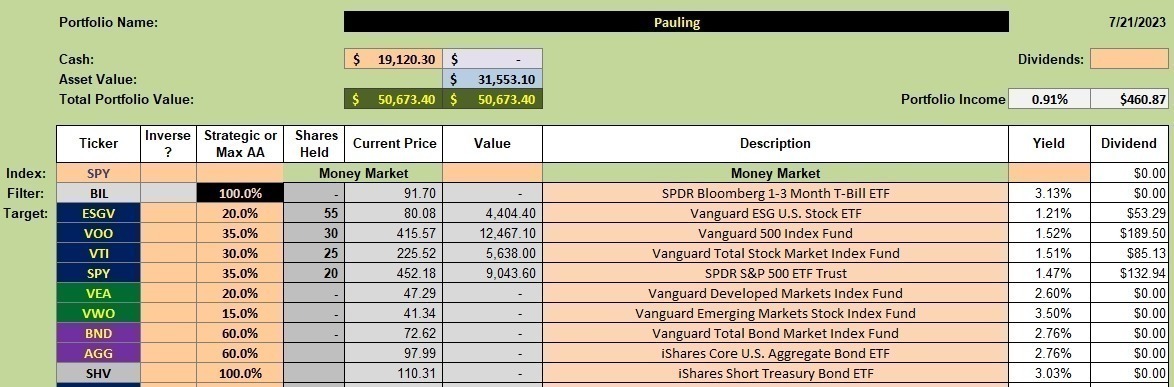
Pauling is the portfolio scheduled for an update this morning. Readers will note the limited number of options as this investment model is very similar to the Dual Momentum™ model. Yes, there is plenty of overlap among the equity offerings so the investment quiver could be paired down to fewer offerings.
Pauling Investment Quiver and Holdings
Since I started writing this blog a limit order was struck adding shares of ESGV to the current holdings.
Readers should note the Strategic or Maximum Asset Allocation percentages I’ve set for the different securities. These percentages are found in the third column from the left.
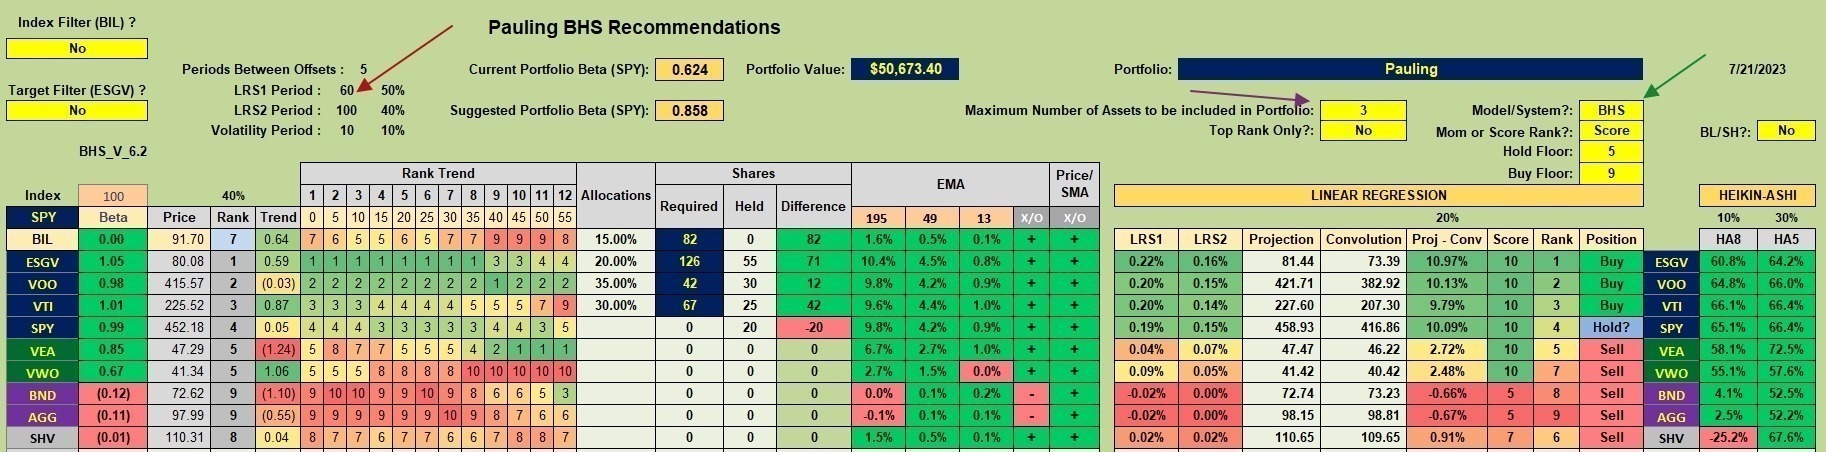
Pauling Security Recommendations
The colored arrows point to critical settings. The red arrow points to the “default” look-back periods of 60- and 100-trading days. The purple arrow indicates a maximum of three (3) securities recommended for purchase at any given time. The green arrow indicates the Buy-Hold-Sell (BHS) is the investing model.
Based on current prices, the purchase recommendations are: 1) ESGV 2) VOO 3) VTI
Pauling Manual Risk Adjustments
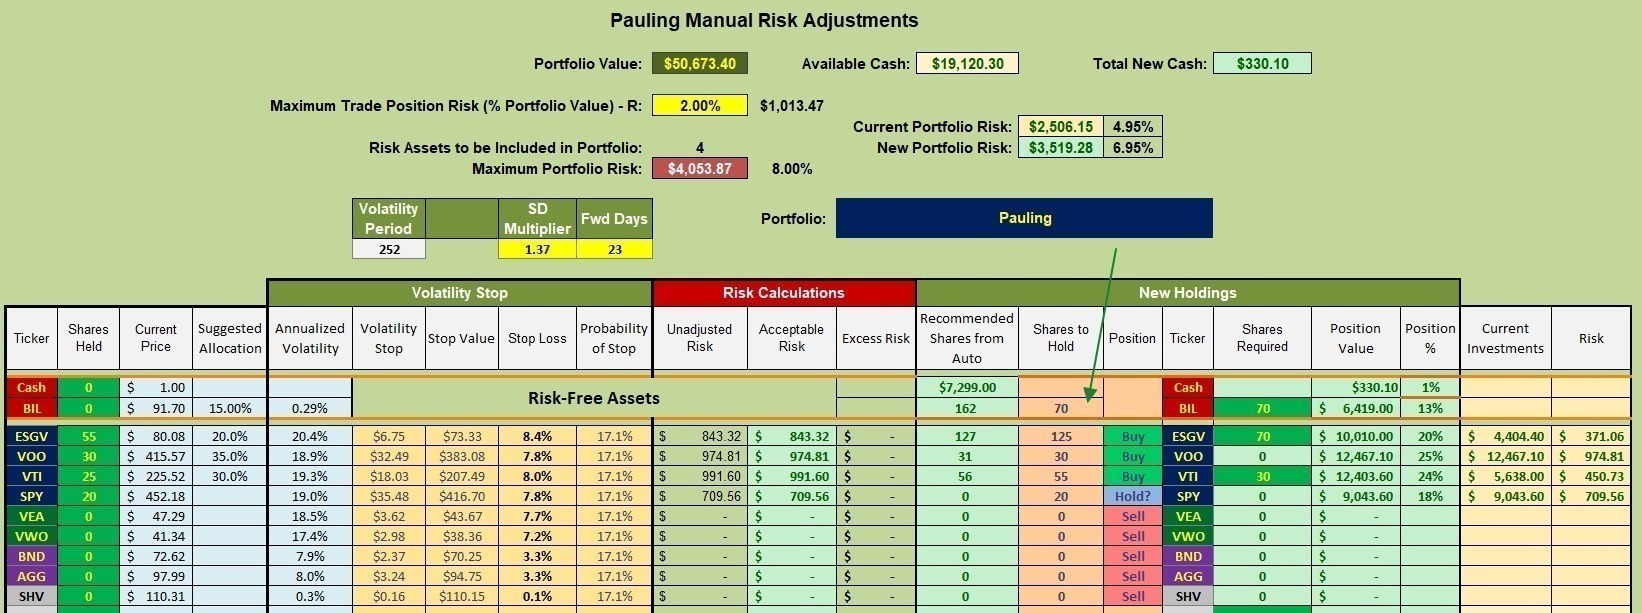
With the market as high as it is I am risk averse so here are my settings. Protection of capital is critical for the owner of this portfolio.
- Adjust the SD Multiplier so the Stop Loss percentage for VTI is 8.0%. I use VTI as it is a broad equity ETF.
- On a prior worksheet the Maximum Portfolio Risk was set to 6.0%. Based on a number of variables that translates to 8.0% in the worksheet shown below.
- Setting the Shares to Hold, identified by the green arrow, we end up with approximately $330 remaining in cash.
While ESGV, VOO, and VYI are recommended for purchase, SPY is a Hold? which means the decision is up to the money manager. I’ll continue to hold 20 shares of SPY in the Pauling.
The BIL recommendation of 162 shares can be thought of as a “overflow” as the ETFs such as VOO reached the maximum percentage I set back in the investment quiver worksheet.
VOO is “full” so no limit orders are set for this ETF.
Pauling Performance Data
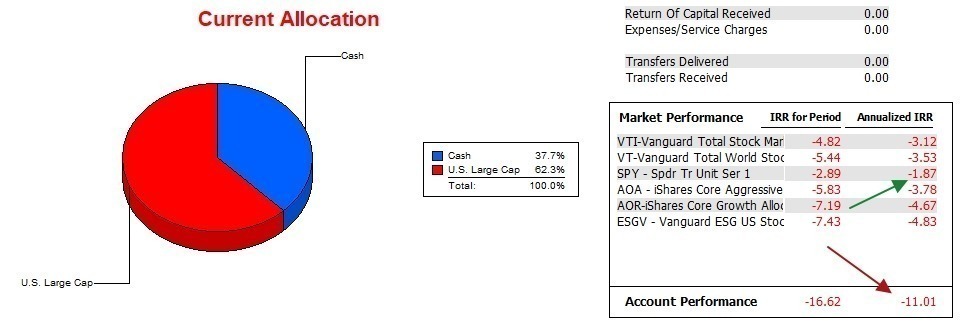
Almost from the very beginning the Pauling fell behind its benchmark (SPY). Once a portfolio is in arrears to this degree, it is nearly impossible to catch up. About the only way the Pauling can catch the S&P 500 is to see a bear market and the portfolio goes to bonds and cash while equities sag. Then buy back equities at a much lower price. Thus far the BHS model has not been all that successful in timing the market all that well so I anticipate the Pauling will continue to lag the SPY benchmark.
Readers will note that SPY is the toughest benchmark to go up against and AOR is the easiest to outperform. This data is closing in on 19 months of information.
Pauling Risk Ratios
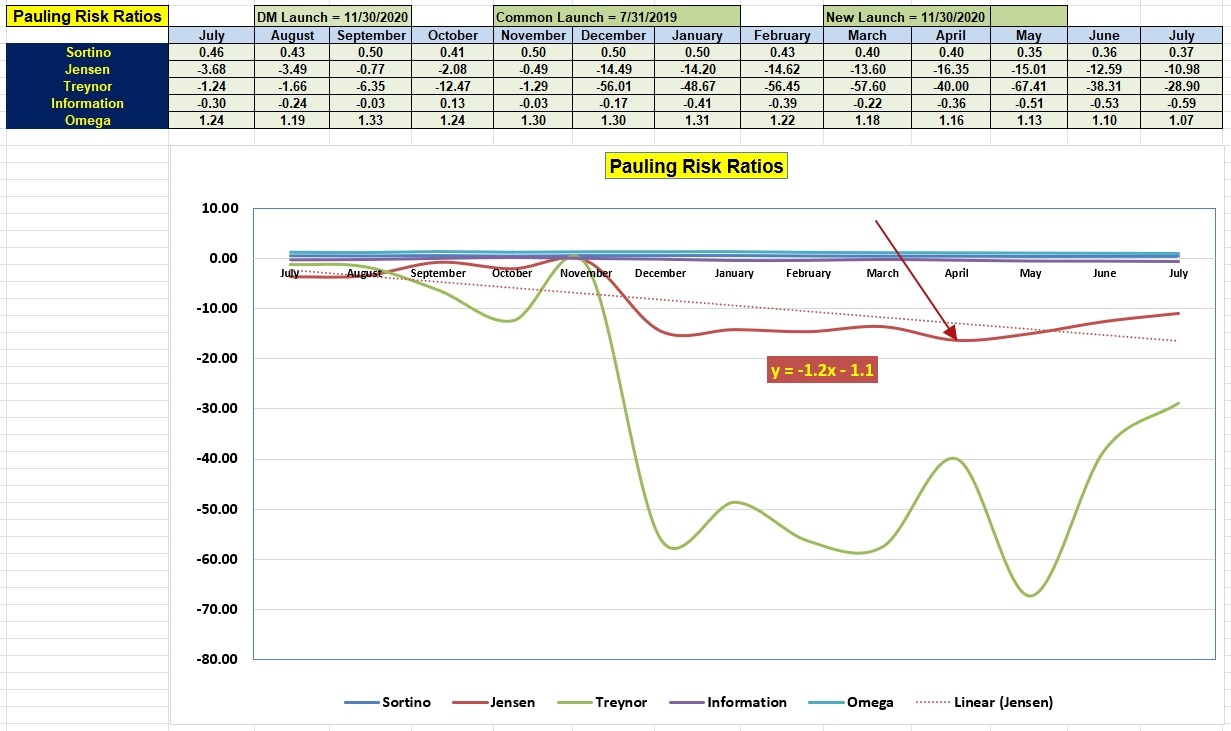
The one glimmer of hope is the performance of the Jensen Performance Index as it is currently in better shape than it has been for the past seven months. We might even see a positive slope for the Jensen by the end of this calendar year.
With such a huge delta value between the IRR of the Pauling and the IRR of SPY, follow the Jensen value to see if the portfolio is making up any ground on the benchmark.
Questions and comments are always welcome. Post them in the Comments section provided with each blog post.
Discover more from ITA Wealth Management
Subscribe to get the latest posts sent to your email.
You must be logged in to post a comment.