
Arneson Gardens
Franklin is one of three portfolios using the Sector BPI management model. The other two are: Carson and McClintock. The Sector BPI model is not designed for all investors as it requires some tracking and a bit of effort. If looking for simplicity, check out the Schrodinger and Copernicus portfolios.
With the sector model we invest in an ETF that mirrors a sector when that particular sector turns bearish. Bearish is defined as a condition when the sector drops to 30% bullish stocks or lower. When the sector reaches an overbought zone of 70% or higher we place a TSLO of 3.0% under the sector.
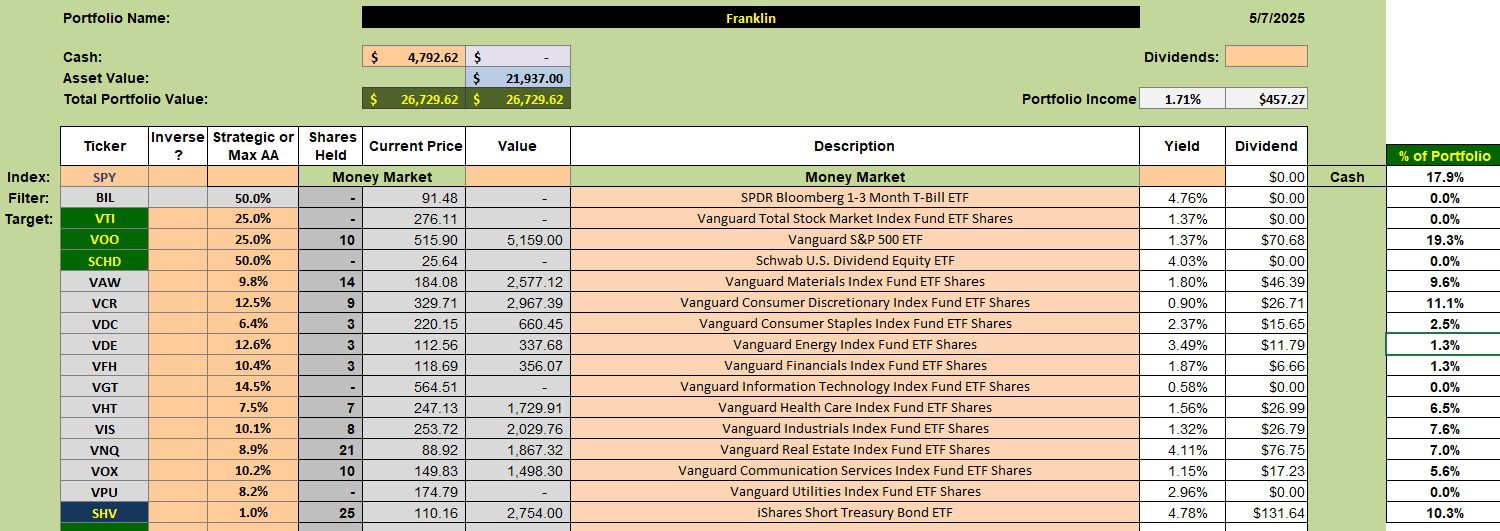
Currently there are four overbought sectors. They are: Financial, Industrial, Technology, and Real Estate. This week Materials dropped out of the overbought zone. Trailing Stop Loss Orders are in place to sell all shares of sector ETFs that have been or were in the overbought zone. In other words, TSLOs are in place to sell all shares of VFH, VIS, VAW, and VNQ. VGT was sold last month and continues to be overbought.
No sectors are oversold so we are not purchasing any sector ETFs. With all the excess cash I purchased shares of SHV so as to increase income. Now we patiently wait for the current holdings to continue to rise or drop to the level where shares will be sold. Sometimes this is a long period requiring patience.
Franklin Security Holdings
Below are the current holdings for the Franklin. TSLOs are in place to sell sectors that are or were overbought. This morning I used available cash to purchase more shares of SHV. That purchase is not showing up on this blog post.
Franklin Performance Data
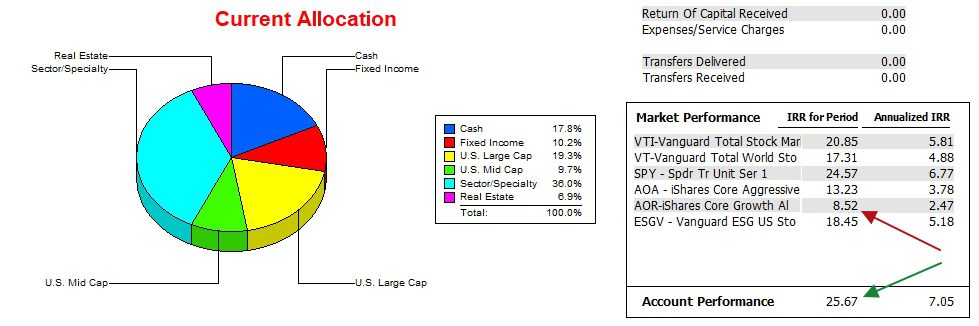
Since 12/31/2021 or 1/2/2022 the Franklin managed to outperform all benchmarks I am tracking using the commercial software program, Investment Account Manager. The lead over AOR is quite significant, indicating the Sector BPI investment model is working with this portfolio.
Franklin Risk Ratio
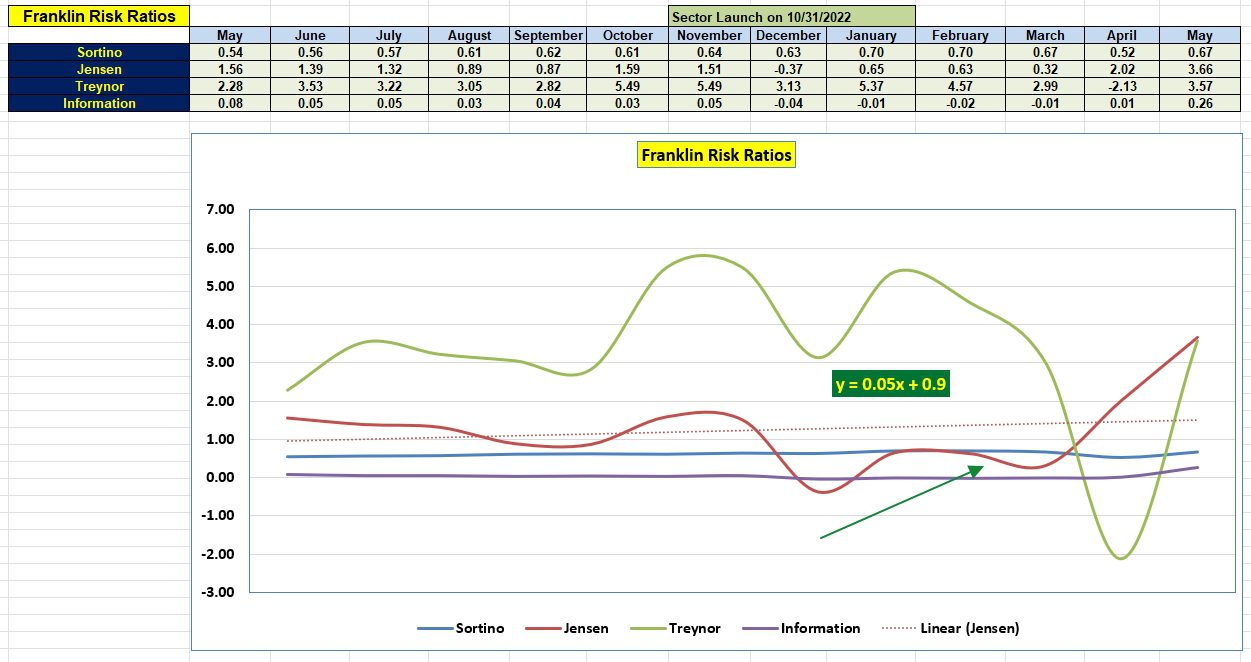
I had some concerns as to how the Franklin might perform in this volatile market. If you check the April to May Jensen Alpha ratio you see a nice move upward. That is encouraging as this increase moves the Jensen slope into positive territory. By adding more shares of SHV this morning the portfolio beta should decrease thus aiding the Jensen Performance Index value.
There is also a nice upward move in the other three risk ratios. The Information Ratio jump is particularly encouraging.
What Should I Do If I Sell My House or Come Into An Inheritance?
Discover more from ITA Wealth Management
Subscribe to get the latest posts sent to your email.
For this portfolio what TSLO % do you use when sell signals arrive and does this change depending on market?
David,
Once a sector moves into the overbought zone I don’t change it. Here is my logic with a few examples.
1. Assume the Materials sector is 76% bullish when the BPI data is updated. At that point I will place a 2.4% TSLO on VAW. 100 – 76 = 24 or converted to 2.4%.
Here is another example.
2. If Technology goes as high as 81% bullish I will place a TSLO of 1.9% under VGT.
Using this logic, the higher the bullish percentage the “tighter” the TSLO. If one prefers not using this logic or the broker does not permit decimal TSLOs, then go with a 3% TSLO when a sector moves into the overbought zone.
Again, once I set the TSLO I don’t change it even if the BPI percentage moves higher. The TSLO does not change based on the market conditions.
Hope this helps.
Lowell