
Farming in mountains of Peru.
Millikan is one of four Sector BPI portfolios undergoing testing here at ITA. March has been a good month for the Millikan as readers will see in a moment. This month is the first time several sectors dropped into the over-sold zone and the recovery has been positive. In the short term the Sector BPI hypothesis is working. More testing is definitely required.
Millikan Sector BPI Investment Quiver and Holdings
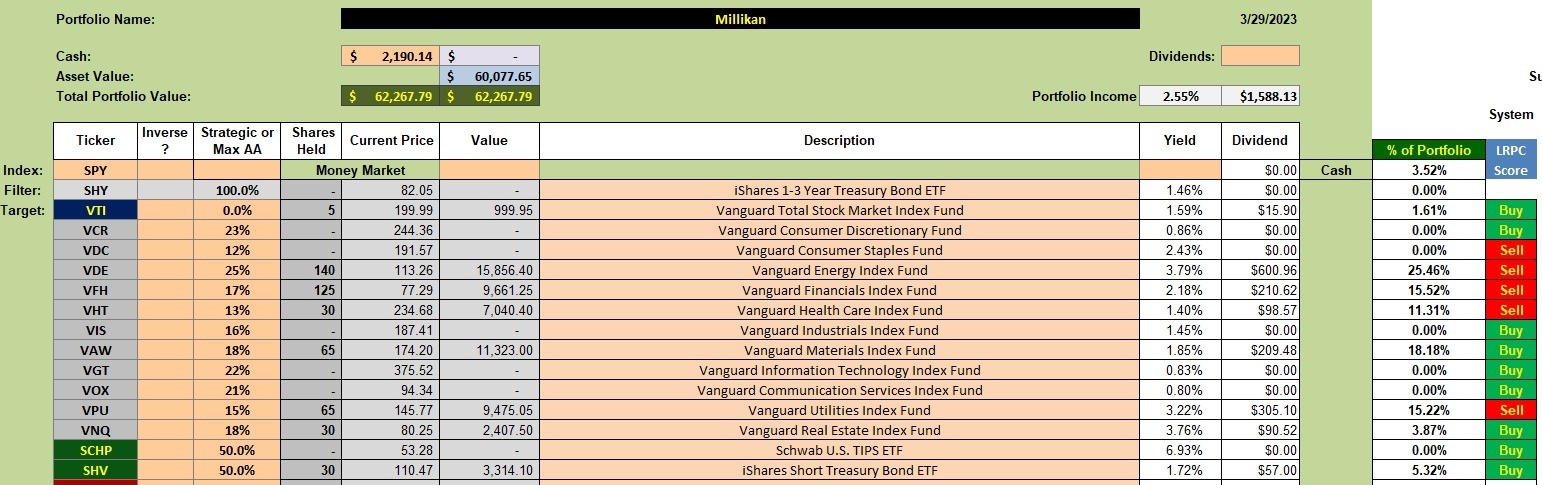
Below is the sector investment quiver and current holdings for the Millikan. The third column from the left specifies the maximum percentage to invest in each sector, assuming a purchase was called for, and the actual percentage held in the portfolio is shown in the second column from the right. The yield is a respectable 2.55%.
The over-sold sector Real Estate (VNQ) is the least populated of the over-sold sectors. There is insufficient cash to bring VNQ up to the recommended 18%. Even if I sell shares of VTI and SHV I don’t have adequate cash to fully populate Real Estate. In situations such as this one, use all available cash to populate the sector most under the recommended percentage and the most volatile sector. A volatile sector is likely to quickly rise to the over-bought zone.
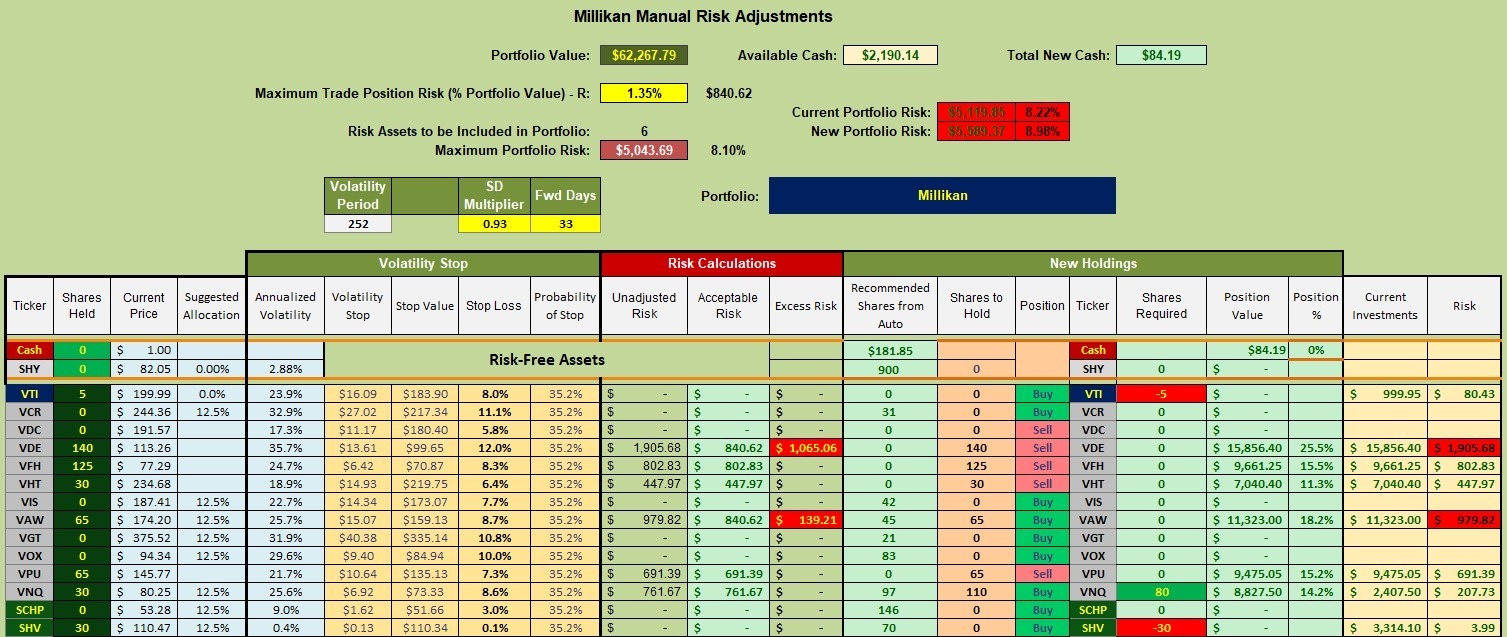
Millikan BPI Adjustments
When I finish this blog I plan to sell 5 shares of VTI and 30 shares of SHV and put that cash to work in Real Estate (VNQ). No other changes are recommended.
Millikan Performance Data
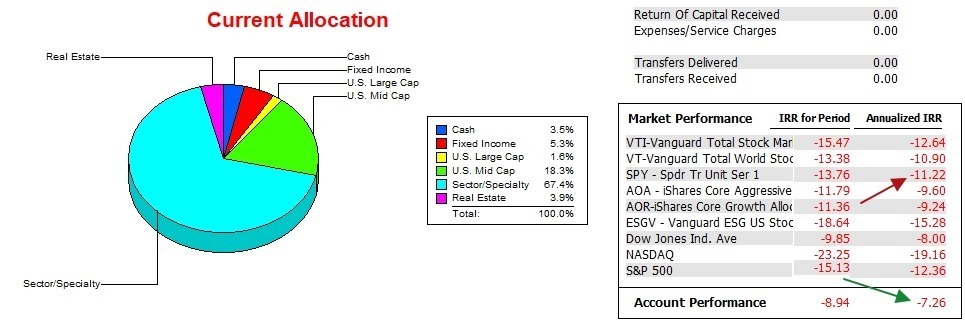
Over the past 15 months the Millikan outperformed the SPY or S&P 500 as well as all other listed benchmarks.
Millikan Risk Ratios
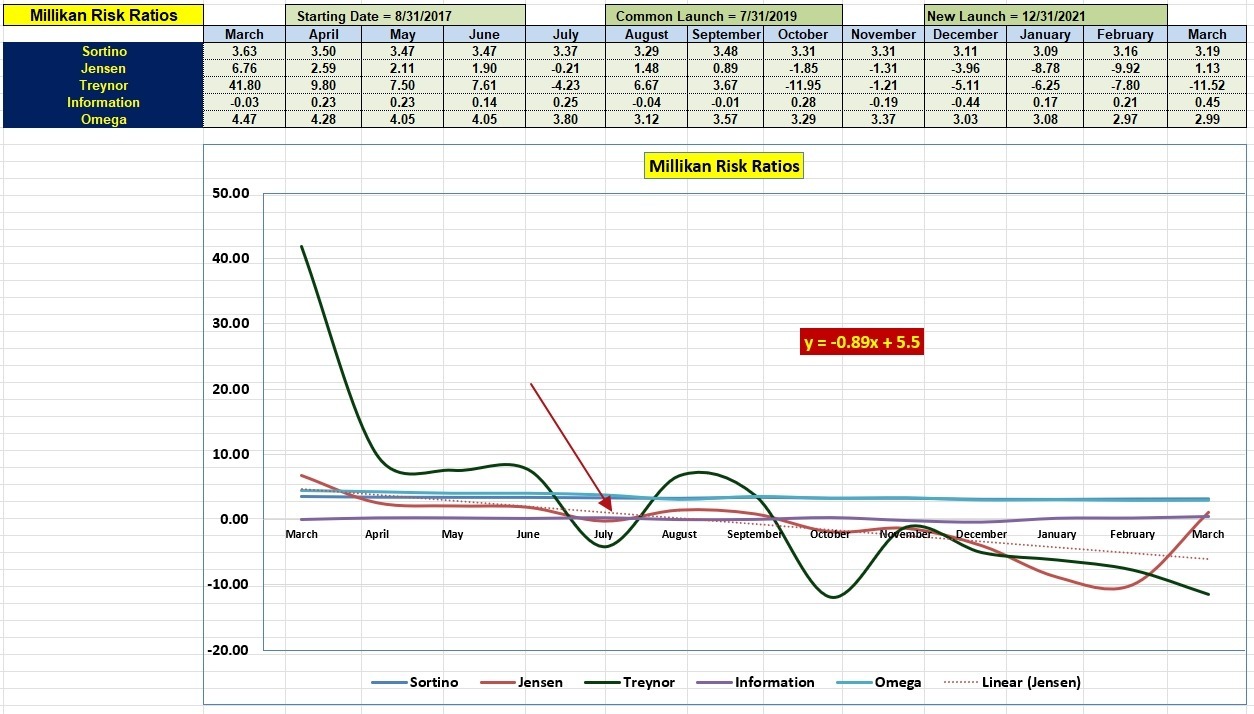
After multiple months of negative Jensen Alpha values, the Millikan finally pushed back into positive territory. I think it is fair to say this is a result of the Sector BPI model. As for the Information Ratio, 0.45 is the highest value in more than a year of operation. This is most encouraging.
Send the itawealth.com URL to your friends and ask then to register as a Guest.
Discover more from ITA Wealth Management
Subscribe to get the latest posts sent to your email.
Lowell, my question on another BPI portfolio was somehow truncated. My full question had to do with also using PnFs in conjunction with BPI. When holding a sector ETF and its BPI goes above 70, could one not use PnF (ie a trend line breaks downward) as a definitive sell point. Likewise, if the BPI is below 30 and is continuing further lower, would it not be helpful to wait to buy until the PnF trend line breaks upward? Thanks.
Martin,
Your suggestion of following trend lines is certainly a possibility. I’m in the process of updating the Gauss this morning and can include a PnF graph to show what your are recommending.
While I don’t know if your method would work, it might miss the high and low price points to a greater degree. I have no evidence for my argument. It is extremely difficult to back-test the Sector BPI model unless one does it by hand and even then I’m not sure one can duplicate the model.
Lowell