
Entrance road into Arches National Park.
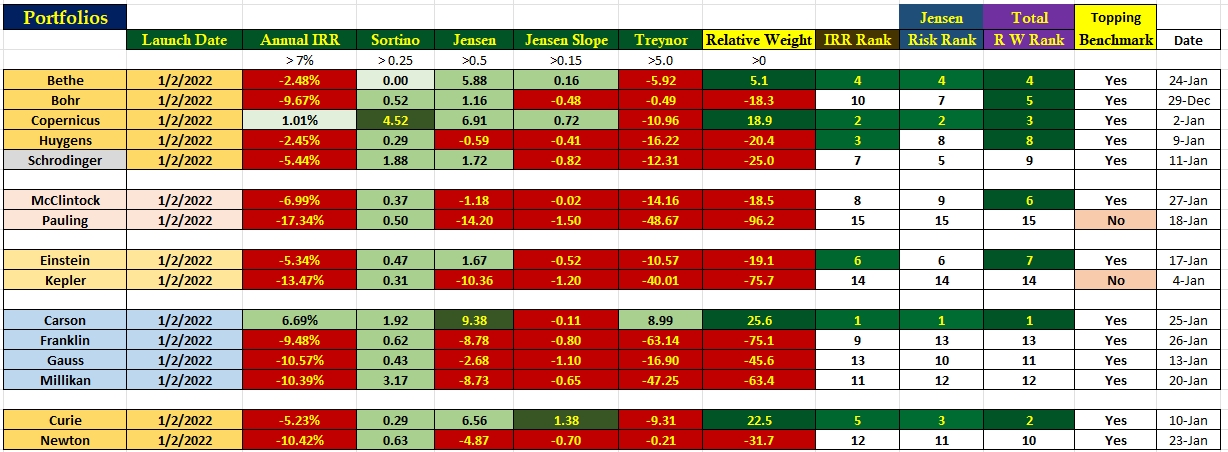
It has been a number of weeks since I last reported on the ITA portfolio performances. Since the last report all portfolios have improved using either return or risk as measuring sticks. Checking the following data table, only two portfolios, Pauling and Kepler, are not keeping up or exceeding the AOA benchmark. I would need to check, but I think all are outperforming the S&P 500 (SPY) which is no mean feat.
Performance Data
To help readers understand the following data table, first note that this information begins at the beginning of 2022 so we have nearly 13 months of information to examine. The reason for the launch date is tied to the Copernicus, one of the newest portfolios. The Annual IRR data is accurate as of Friday (1/27/23). The risk data such as Sortino, Jensen, Jensen Slope, and Treynor is accurate based on the date found in the far right-hand column.
On the right side of the table there are cells with dark green backgrounds. Those are the cells that use the Schrodinger as the benchmark. For example, based on IRR data, portfolios outperforming the Schrodinger are: Carson, Copernicus, Huygens, Bethe, Curie, and Einstein.
Portfolios outperforming the Schrodinger when using the Jensen Alpha as a reference are: Carson, Copernicus, Curie, and Bethe.
Eight portfolios are besting the Schrodinger when using the Relative Weight measurement and they are: Carson, Curie, Copernicus, Bethe, Bohr, McClintock, Einstein, and Huygens.
Keep in mind the Carson is a Sector BPI portfolio and the Copernicus is a U.S. Equities only portfolio.
While it is still much too early to come to conclusions as to how well Sector BPI portfolios will do in the future, we can conclude that holding securities for the long term is paying off as we see from the top group of portfolios. Looking at the Total Relative Weight Rank, portfolios Bethe through Schrodinger are holding up quite well.
Definition of Information Ratio
“The Information Ratio (IR) is a measure of the risk-adjusted performance of an investment portfolio. It is used to evaluate the consistency of a portfolio’s returns in relation to its benchmark. It is calculated as the portfolio’s excess return (the difference between the portfolio’s return and the benchmark’s return) divided by the portfolio’s tracking error (the standard deviation of the portfolio’s excess returns).
The formula for IR is:
IR = (Portfolio Return – Benchmark Return) / Tracking Error
An information ratio greater than 1 indicates that the portfolio’s excess return is greater than the volatility of that return and the manager is adding value. A ratio of less than 1, means that the portfolio is not providing enough return for the risk taken. The higher the information ratio, the better the risk-adjusted performance of the portfolio, as it shows that the portfolio is providing a higher return for a given level of risk compared to the benchmark.”
Check the above link and readers will see the improvement with respect to the AOA benchmark since the December performance report.
Discover more from ITA Wealth Management
Subscribe to get the latest posts sent to your email.
Over the past 13 months the combination of all 15 ITA portfolios I track outperformed the S&P 500 (SPY) by 4.4 percentage points.
Lowell