
Temple, Bali, Indonesia
Although US equity markets were a little jittery (read volatile) over the last week it was essentially a period of consolidation with the SPX (S&P 500 Index) making more new highs and closing the week ~0.6% higher than last week’s close:
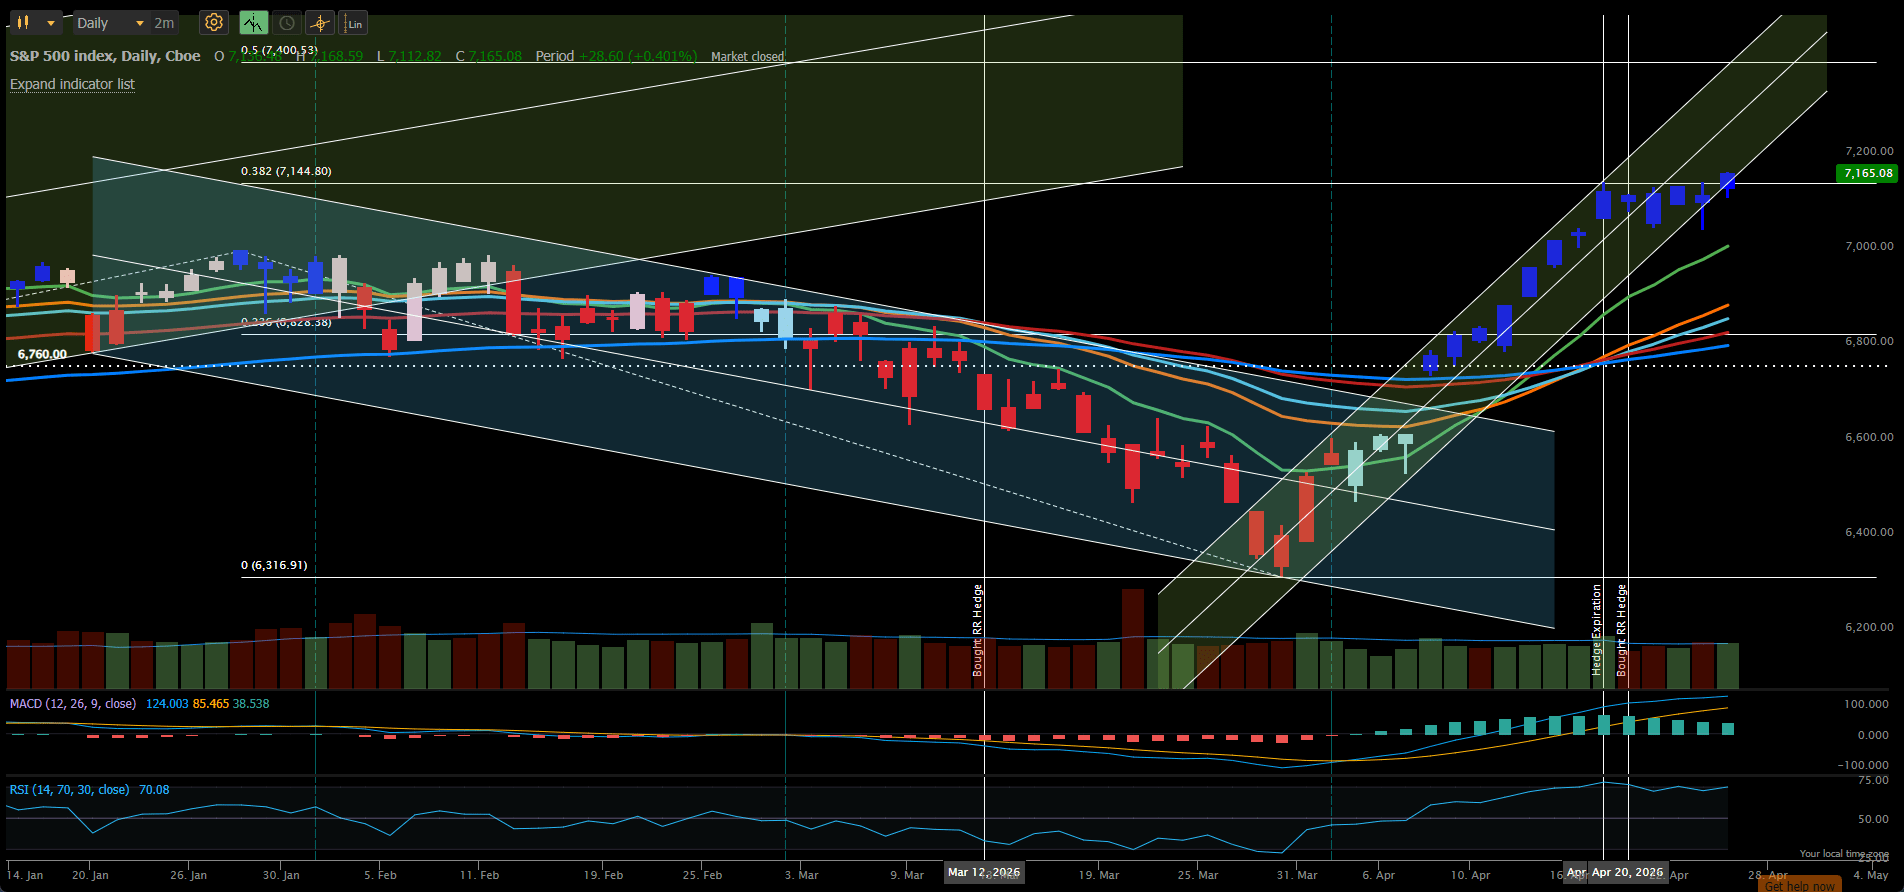
Technically, the ~7145 consolidation level is at the 38.2% Fibonacci extension level from the recent pullback/correction lows at the end of March and based on the strength of the prior bullish trend. We now wait to see whether this represents true resistance or whether we break through this, in a continuation of the new bullish trend until we might hit the 50% extension level at ~7400. If this turns out to be strong resistance we will likely pull back to test the 7000 and/or 6800 levels that formed the highs and lows of the February/March consolidation channel. Meanwhile we can probably expect to see more of the same volatility and rotation of money between asset classes and sectors.
Relative to other major asset classes US Equities stacked up fairly well:
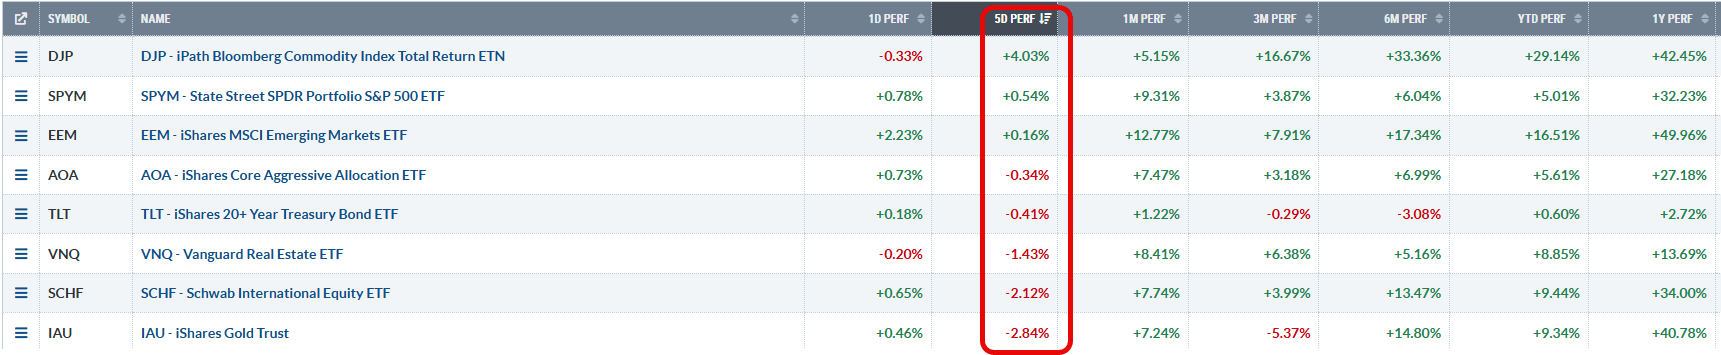 only being beaten out by commodities (oil) that bounced 4% higher over the past week on news that the Strait of Hormuz is still closed to shipping and that oil prices are likely to rise even further. Gold was the loser on the week with a 2.8% price decline.
All this volatility and sideways consolidation is not usually good for momentum systems, so let’s see where we stand when we take a look at the Darwin analysis sheet:
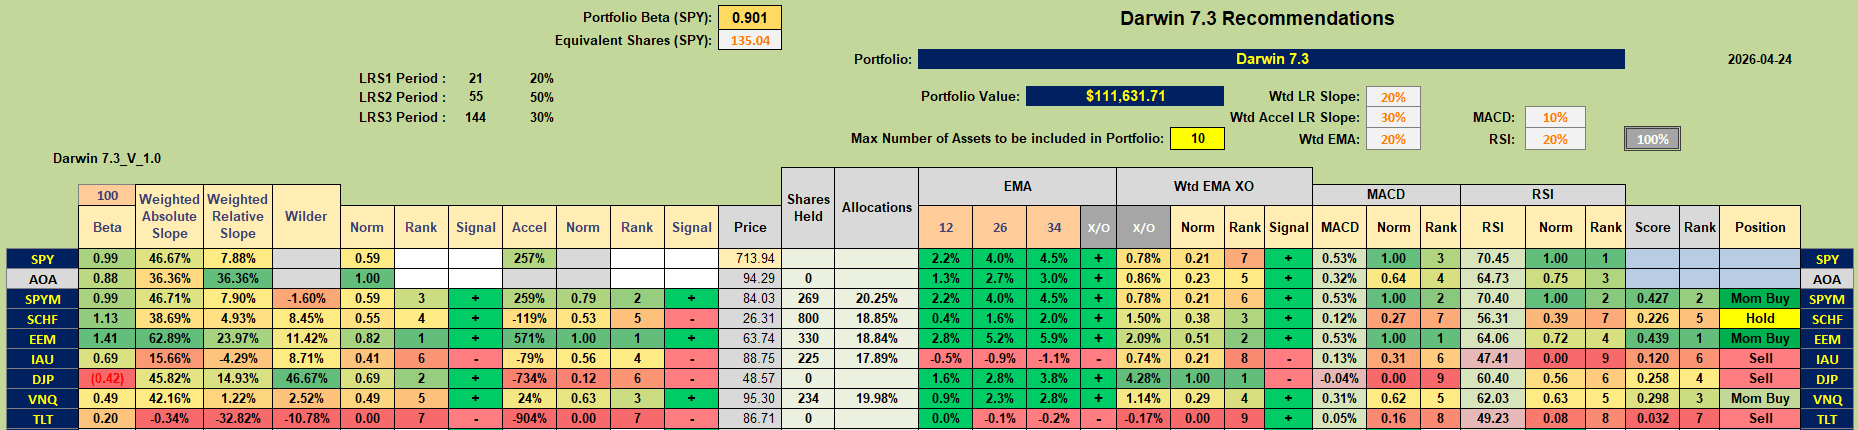 The system used to manage this portfolio is a momentum/acceleration model that relies primarily on momentum averaged over 3 lookback periods (~1 month, 3-months and 7-months) with the objective of being able to hold assets for an intermediate length of time – ideally at least 1 month. However, in the current choppy markets, this is not an objective that is easy to meet.
Up to this point (the first 4 months of using this system) I have classified assets as potential Momentum Buy, Mean Reversion Buy, Hold or Sell candidates based on the signs of momentum and acceleration (rate-of-change of momentum) as shown in columns eight (8) and twelve (12) from the left in the above screenshot. I have then made “discretionary” adjustment decisions based on my observations of price action in shorter time frames by looking at:
- Whether momentum has crossed above or below it’s 12-period Wilder Moving Average;
- Whether the Moving Average Convergence-Divergence (MACD) Indicator is positive or negative;
- Whether the Relative Strength Index (RSI) is greater or less than 50.
I have now adjusted my algorithm to reflect more (maybe) precise rules/guidelines for making adjustment decisions. I have retained the same recommendation classifications but have built rules that include the above three signals to color code the recommendations shown in the second (2nd) column from the right. There are potentially:
- three (3) shades of green for Momentum Buy recommendations:
- three (3) shades of blue for Mean Reversion Buy recommendations:
- two (2) shades of yellow for Hold recommendations, and
- two (2) shades of red for Sell recommendations.
The stronger the shade of color, the stronger is the recommendation.
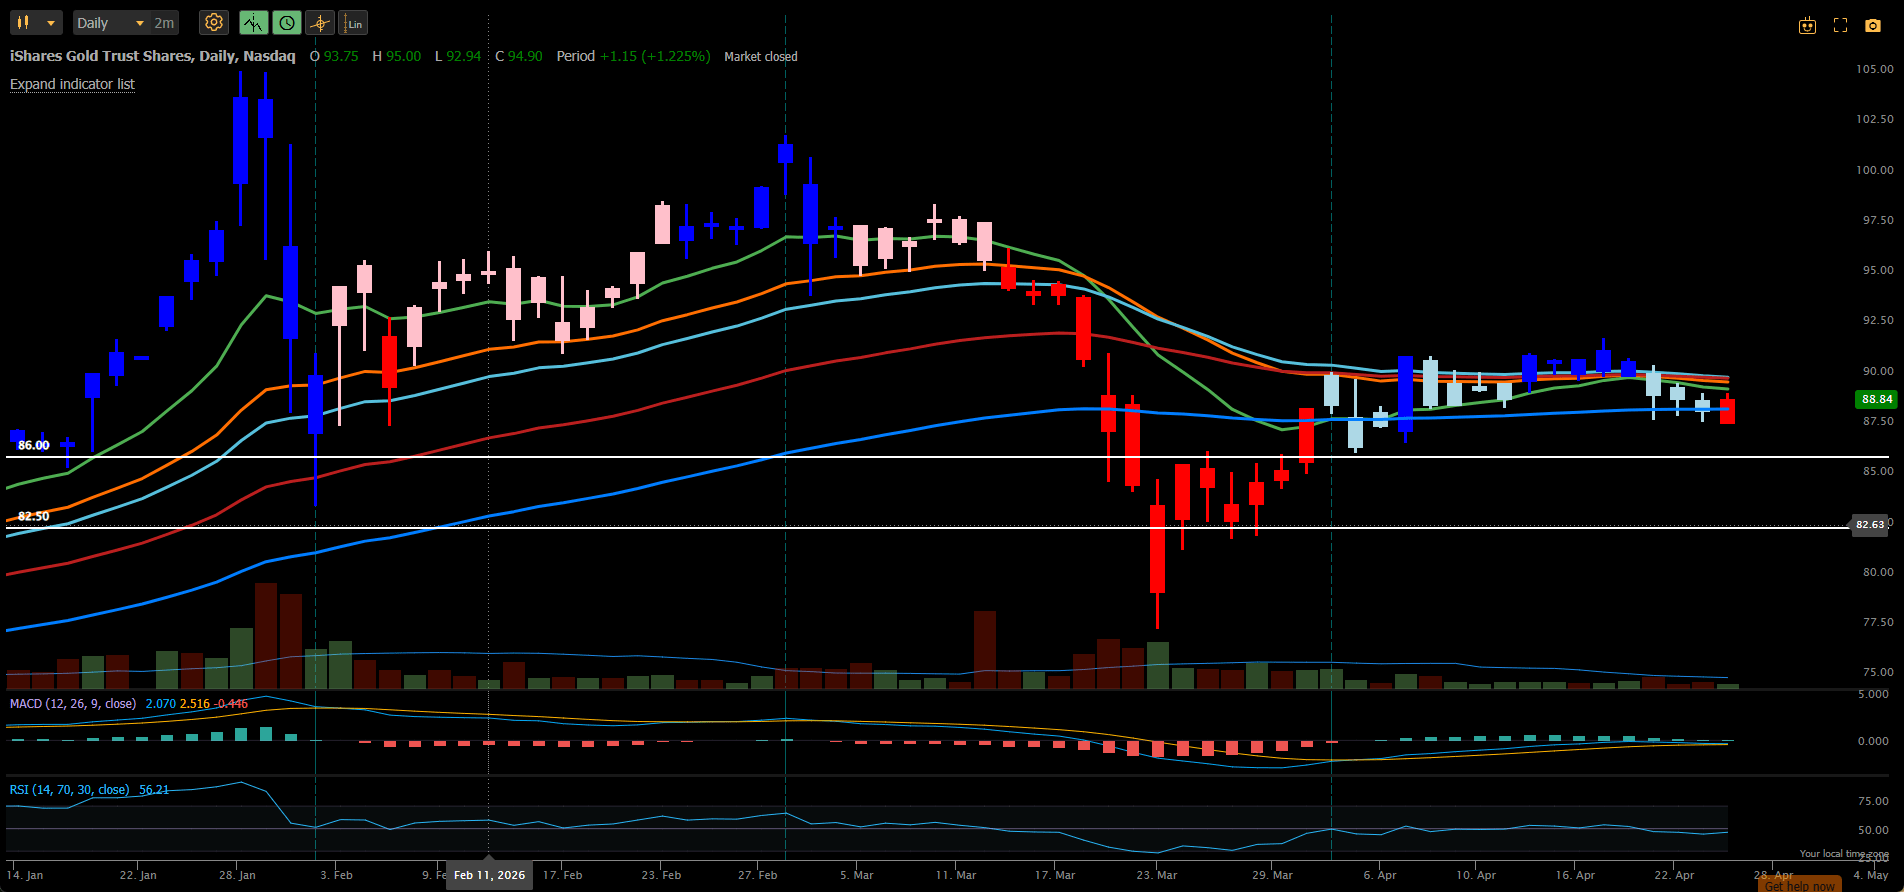
Looking at the above screenshot we see that I am presently holding Gold (IAU) in the portfolio and that it is signalling a Sell recommendation, So, let’s take a look at the momentum/acceleration graphs:
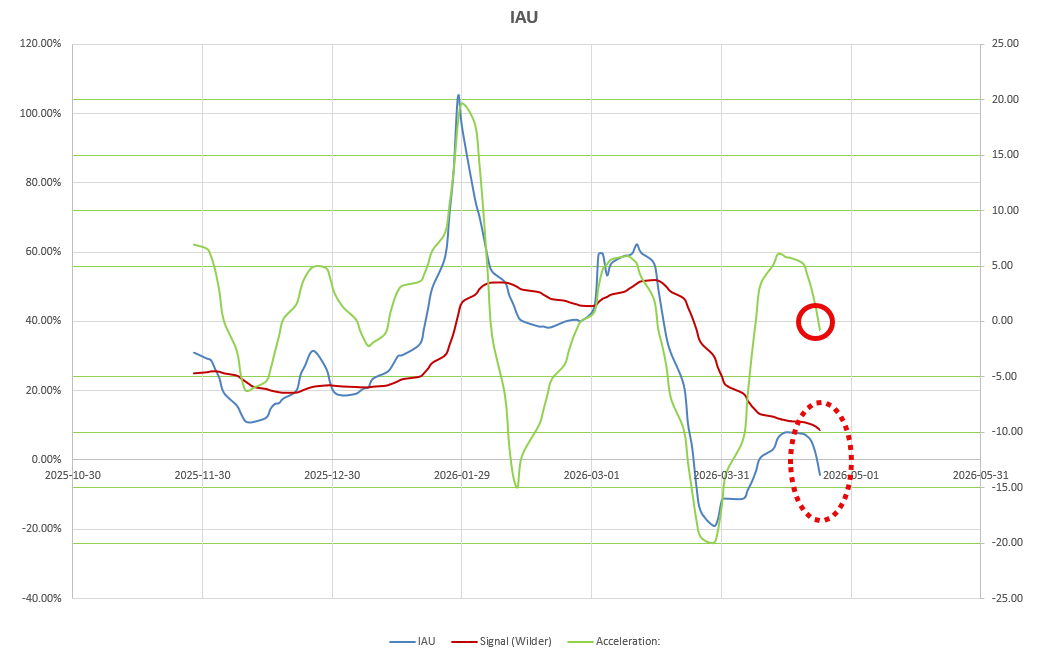 Acceleration (green line) turned negative on Friday, as did momentum (blue line) – a clear Sell signal – but how strong/convincing?
- Firstly, momentum is falling and presently below it’s 12-period Wilder Moving Average (brown line) – so, first strike against it;
- Secondly, RSI is at 47.41 – slightly less than the 50 “neutral” level – so, second strike against it;
- Thirdly, MACD is slightly positive at 0.13% – so, maybe a little hope, but not enough to kick the Sell recommendation up a notch – hence a dark red background on the Sell recommendation.
I considered selling IAU on Friday, but it was trading above the prevoius day’s close so I did not sell. However, should IAU be trading lower than Friday’s close I will be selling on Monday. This last check on where the current day’s price is trading relative to the prior day is my last check before deciding on the adjustment. Should price continue upward from here MACD should get more positive, RSI should move above 50 and momentum might even cross it’s Wilder Moving Average and the Sell signal would shift to a Hold or even a Buy recommendation. However, presently, IAU is not showing strength:
This was the only adjustment consideration for this past week since we did not get any more new Buy or Sell signals. However, SCHF (Developed Market Equities) did switch to a Hold recommendation, so let’s take a look at what changed there:
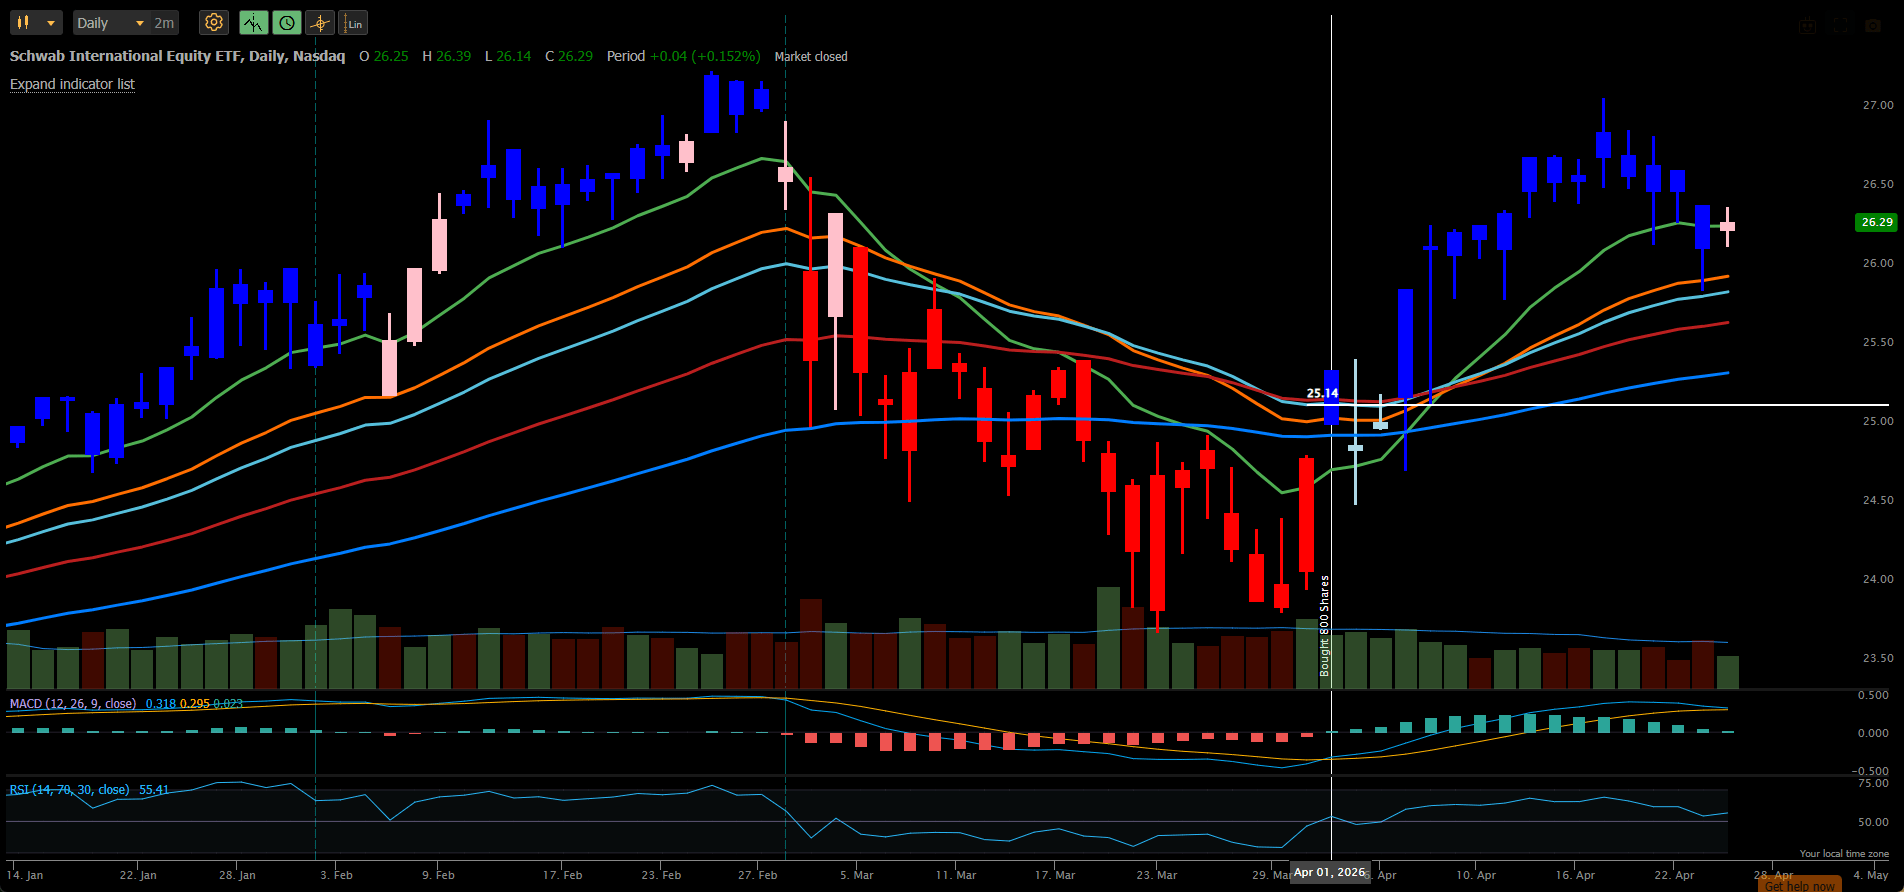
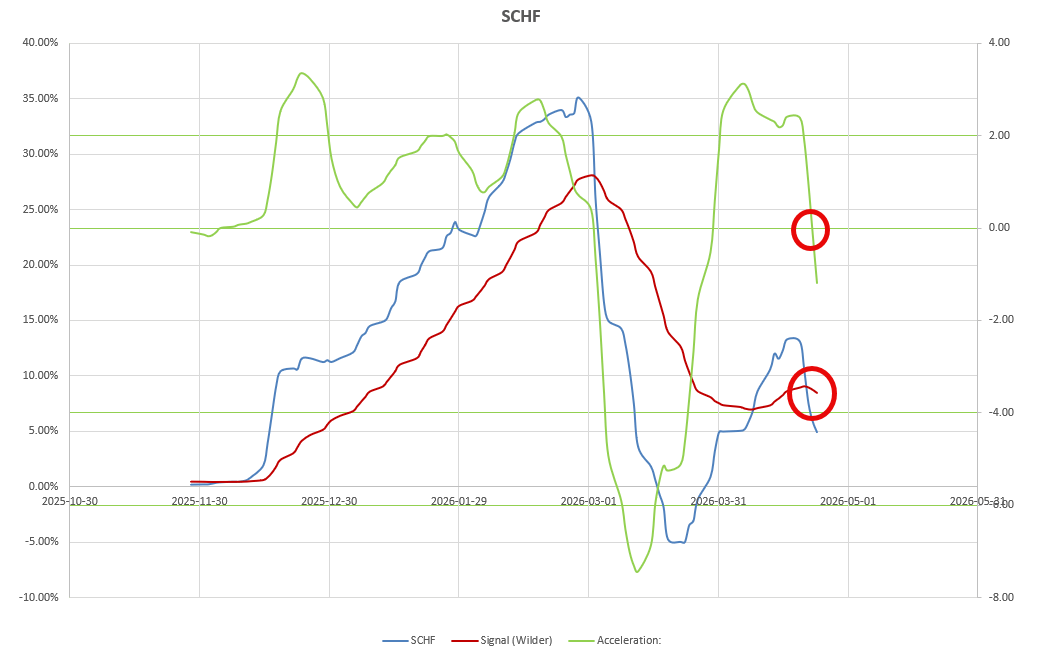 where we see that acceleration turned negative and momentum, while staying positive on the longer-term relative basis, still managed to cross below it’s Wilder Moving Average line. With MACD positive and RSI greater than 50, SCHF is not showing sufficient short-term weakness to flip this recommendation to a Sell – but this could change quickly so the recommendation is currently a strong Hold (deep yellow) but could quickly change to a weak Hold (paler yellow) should one of the shorter-term indicators switch signals (MACD<0 or RSI<50) or even to a Sell should momentum turn negative.
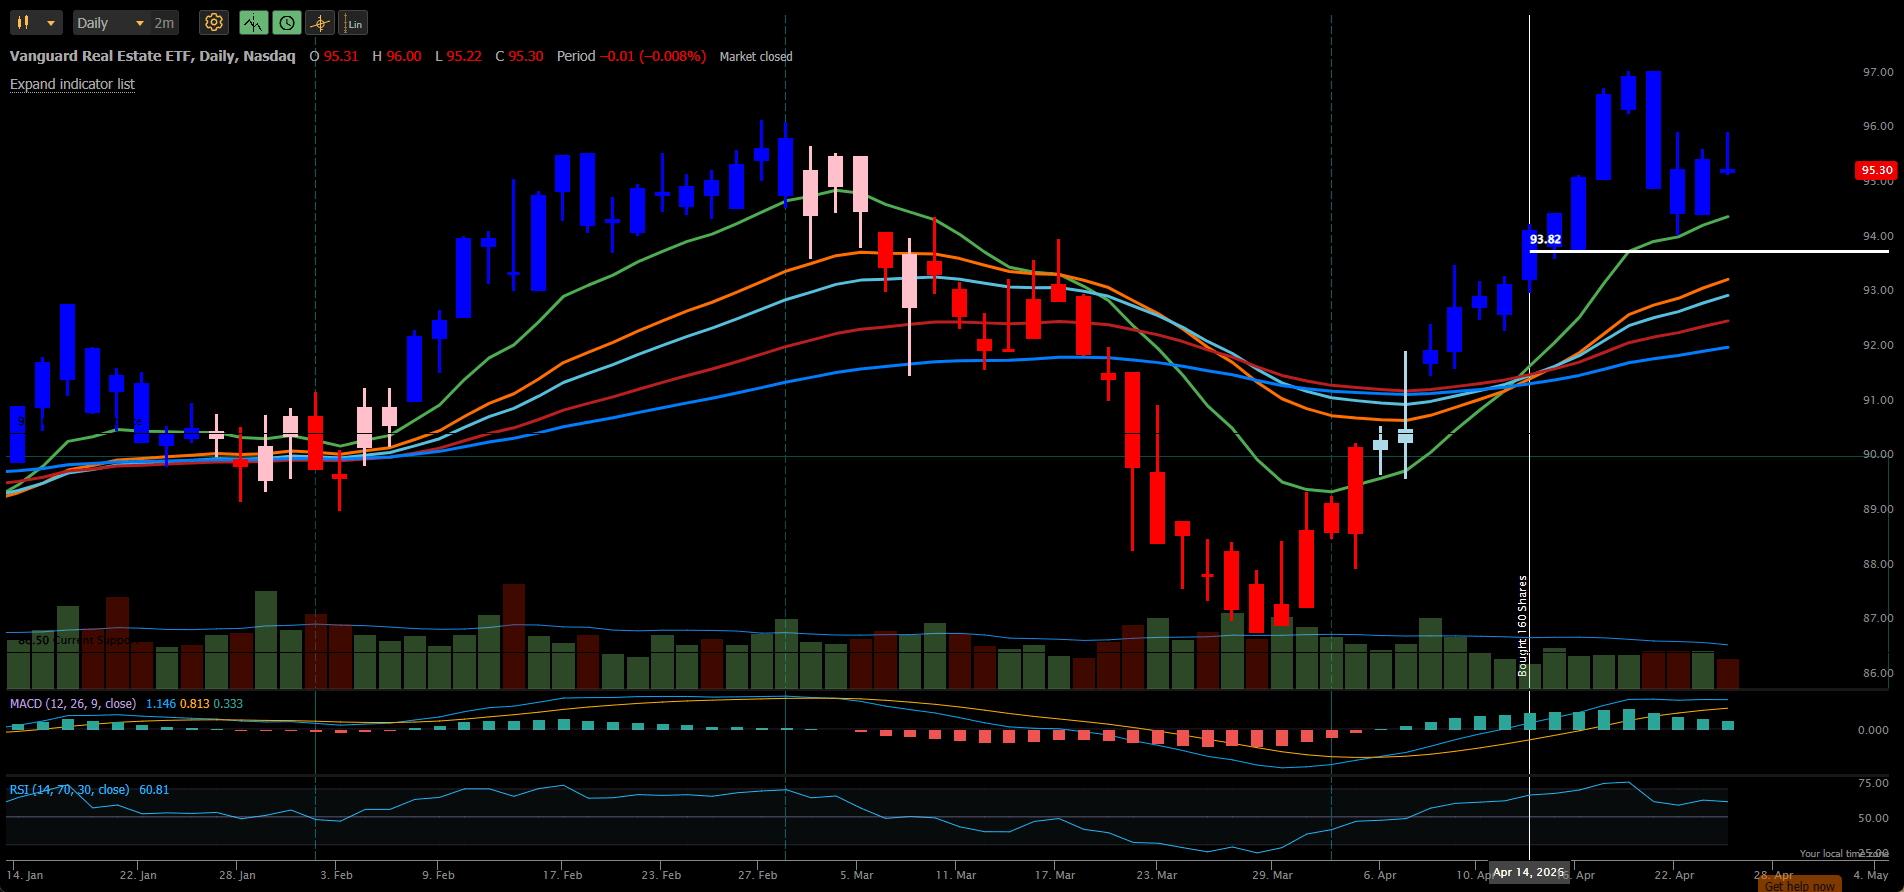
VNQ is also showing a mid-tone green signal, so let’s see what’s happening here:
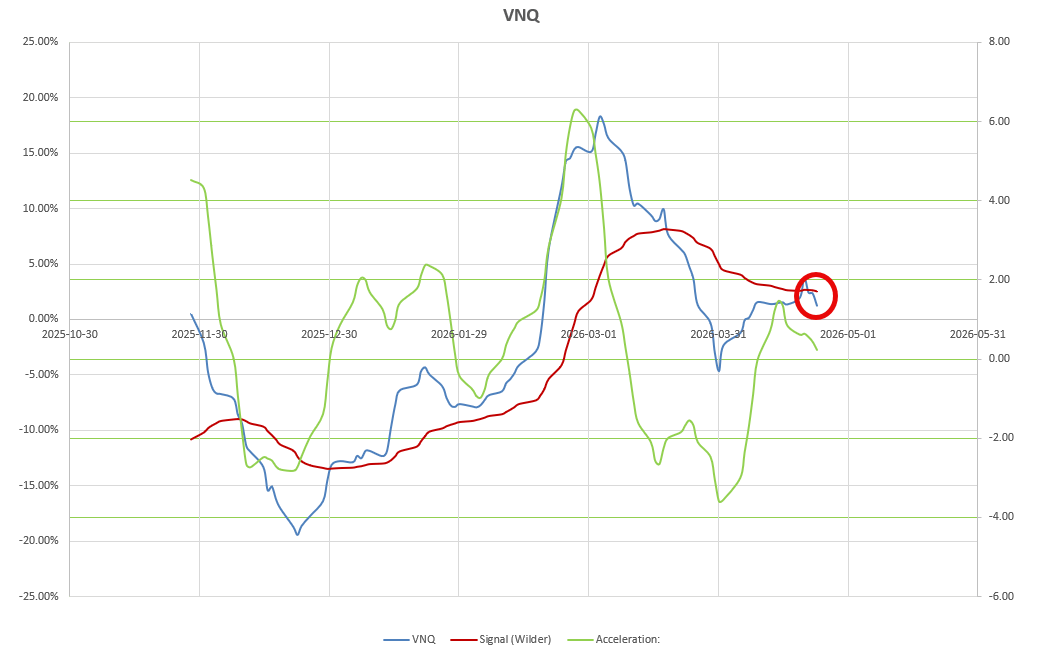 where we see that whilst both momentum and acceleration are in possitive territory, they are both pointing downwards and momentum has just dropped below it’s Wilder Moving Average – so the Momentum Buy recommendation is weakened slightly. Maybe no panic called for here, and we maybe in a normal pullback situation, but maybe an early warning signal of weakness to come so a downgrade in the recommendation.
 While we’re still looking at charts to try to understand what’s going on we’ll take a look at commodities, that topped the performance comparisons over the past week:
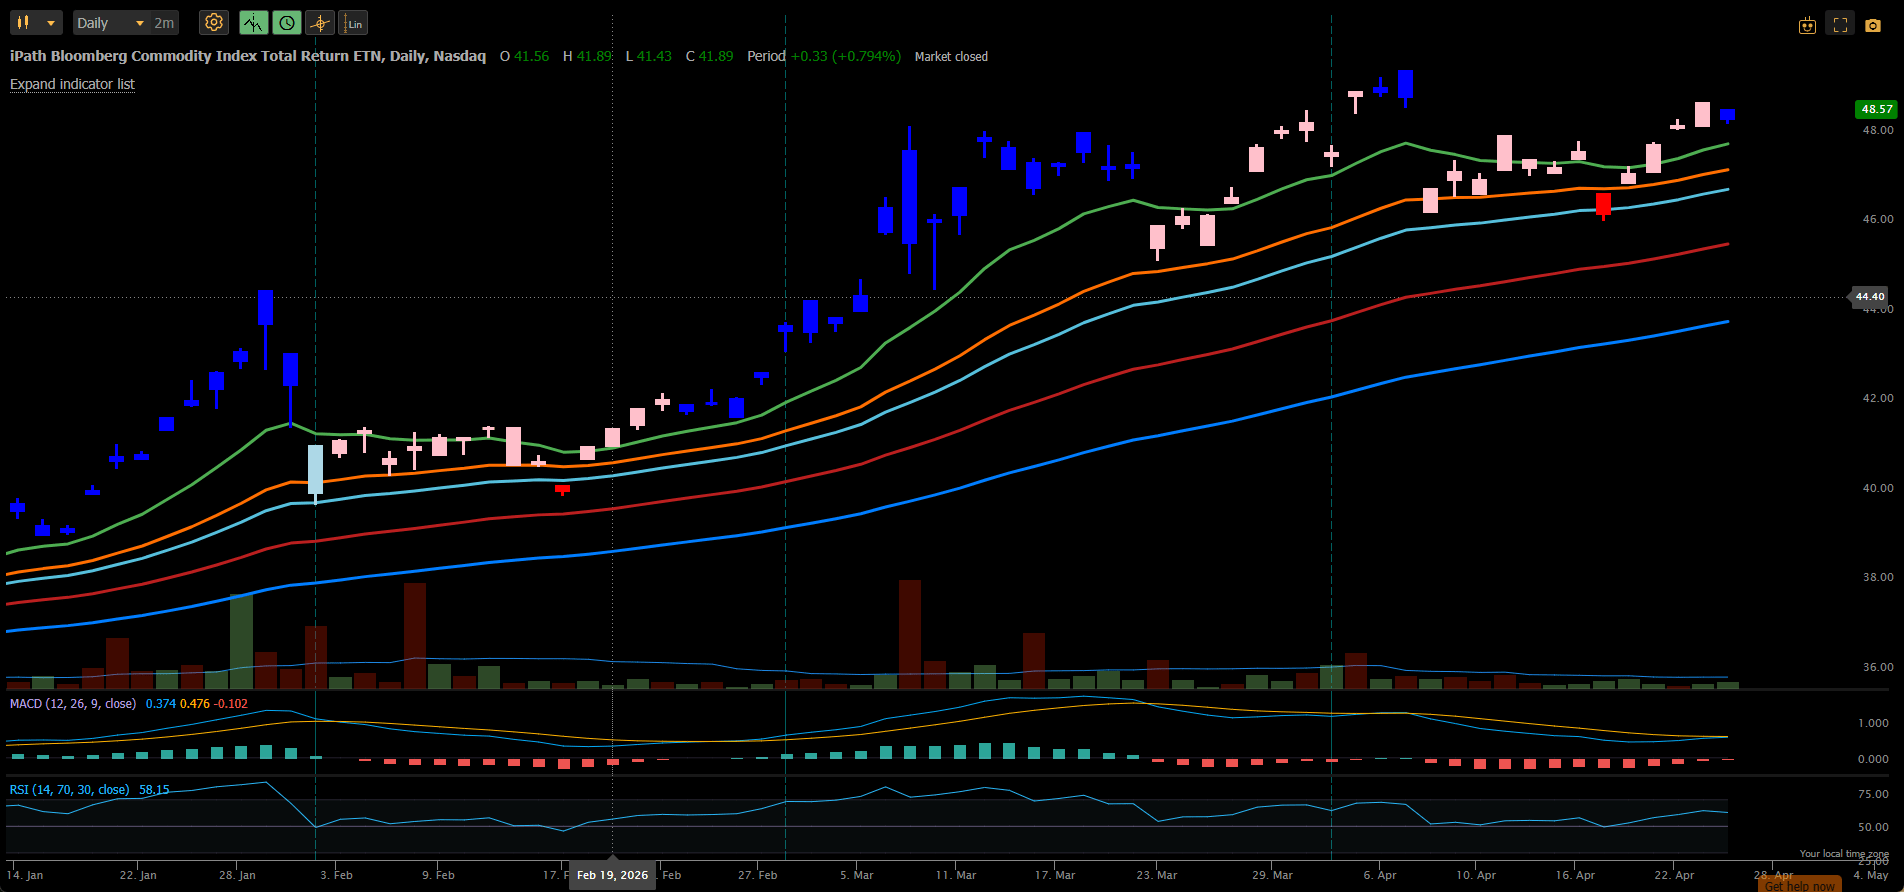 I sold out of my position in DJP a little over 2 weeks ago, taking nice profits, as investors thought that the war in the Middle East might be over and commodity prices dropped. However, we still have no better idea of when this might happen so Oil prices are continuing to rise, and we need to assess whether it might be time to re-enter the commodity markets. Taking a look at the momentum/acceleration graphs:
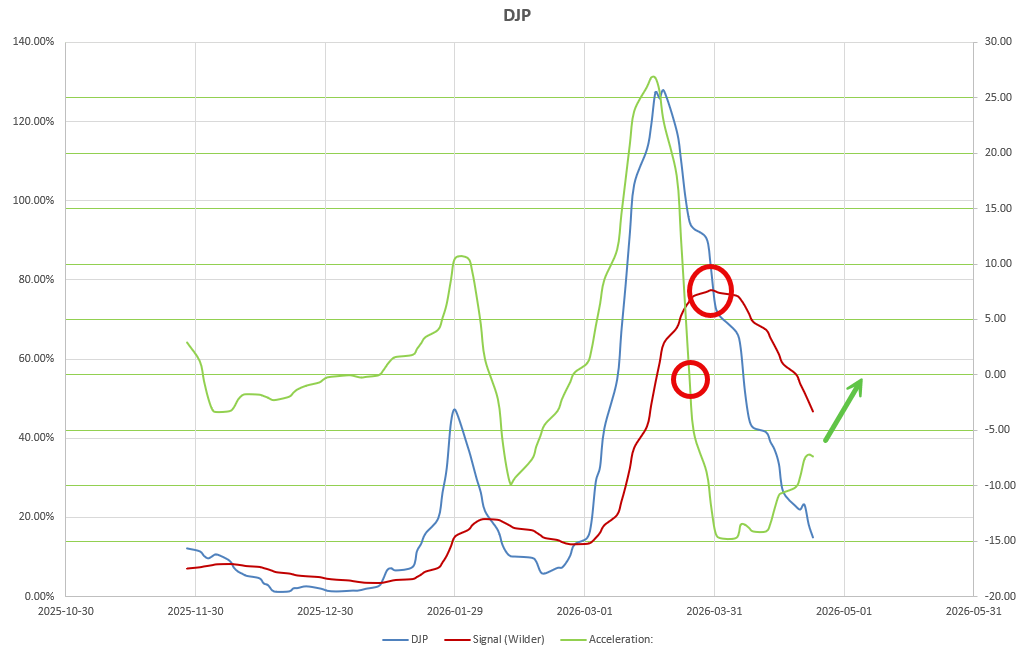 we see where we got the sell signals at the end of March and now we see acceleration on the upswing with longer term relative momentum still in positive territory. If we see a continuation of the bullish acceleration trend, coinciding with positive indicator signals (RSI is currently >50 and MACD could well turn positive early next week) then it may well be time to re-enter. I will be watching this one closely.
In the meantime – bottom line – portfolio performance to date looks like this:
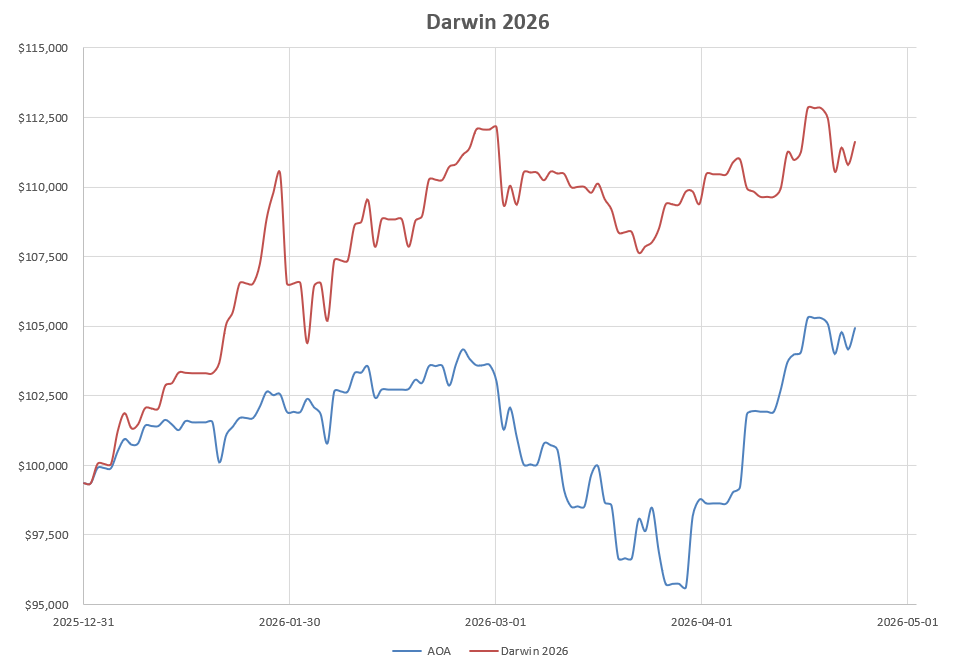 with a small loss on the week but closely mirroring the benchmark AOA Fund and behaving well under the circumstances and in the current environment.
Discover more from ITA Wealth Management
Subscribe to get the latest posts sent to your email.
Yesterday I sold my holdings in Gold (IAU) out of the Darwin Portfolio.