
Pumpkin Carving
Gauss is one of six Sector BPI Plus portfolios managed here at ITA. Recent additions to this investing model are: Bohr and Bethe. Since the beginning of this year the Gauss reversed the Jensen trend from negative to positive and it continues to outperform the S&P 500 (SPY) benchmark. This week I sold off shares of BIL to raise cash so investments in the oversold sectors might be populated.
Moments ago I checked the BPI percentages for the eleven sectors and I see where Materials (VAW) just moved out of the oversold zone. I missed the opportunity to invest in the Materials sector. This leaves Discretionary, Staples, Health, Utilities, and Real Estate as the remaining Buy recommendations.
Gauss Investment Quiver and Holdings
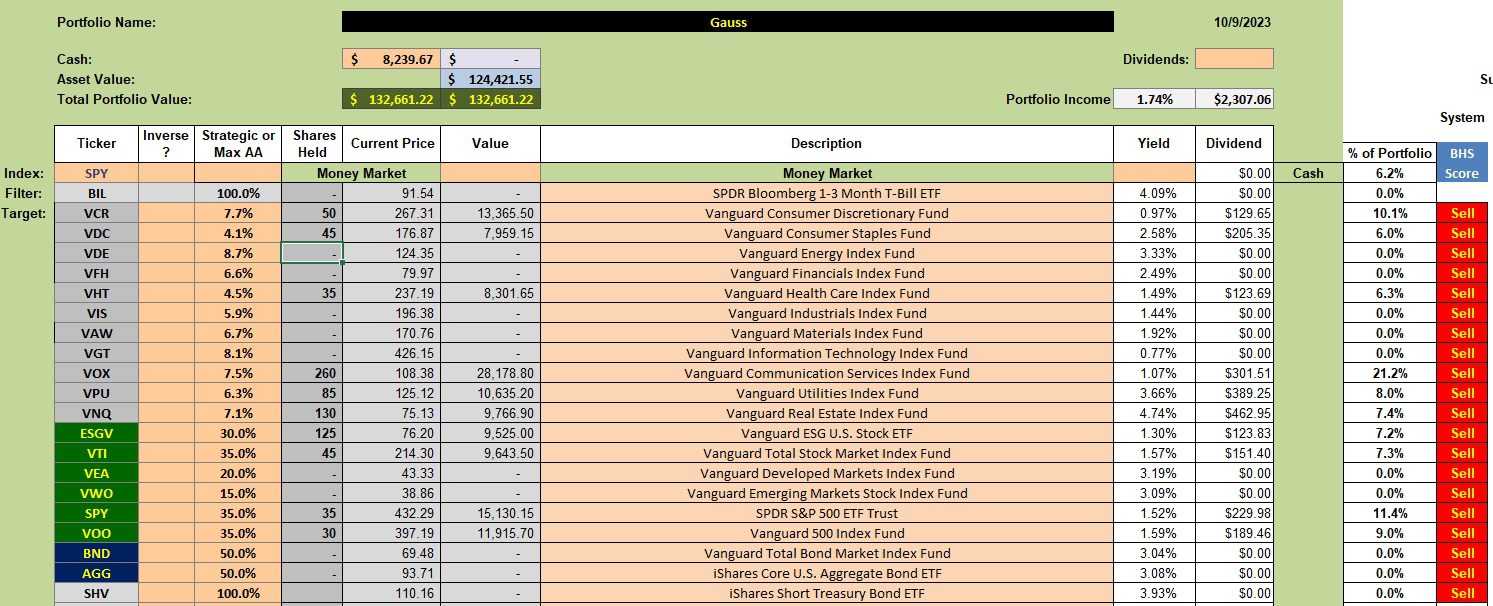
Below is the investment quiver and current holdings in the Gauss. VOX is the lone sector that is significantly oversubscribed based on the recommended percentages. The Gauss has been holding this sector ETF for many months.
The percentage to hold in a recommended sector is found in the third column from the left. For example, VCR should hold 7.7%. Currently it is holding 10.1% as you can see from the second column from the right.
Gauss Security Recommendations
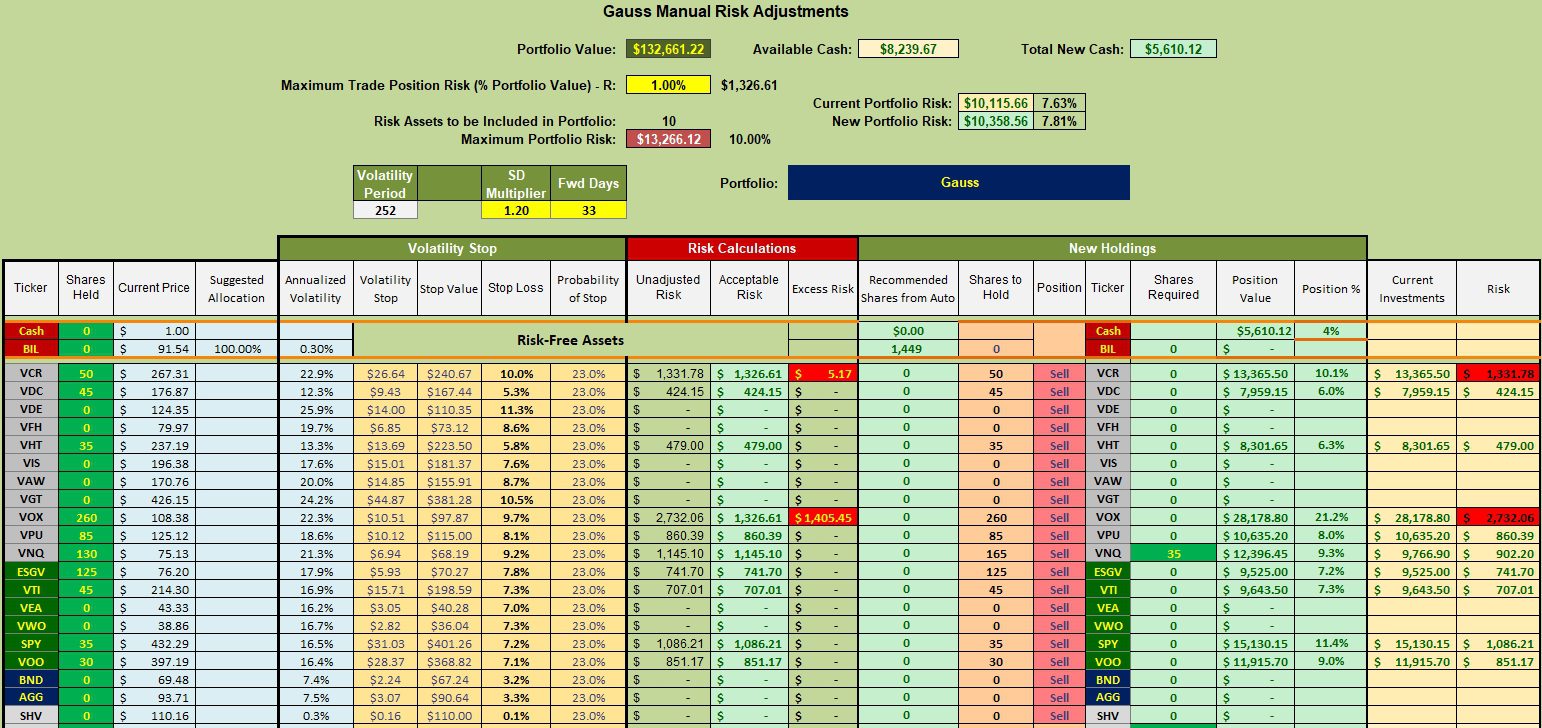
The following worksheet comes from the Kipling spreadsheet. This particular worksheet is only used if there is excess cash available after all the recommended sector ETFs have been filled. Based on the current recommendations we would not be adding any more equity shares or buying VTI, ESGV, SPY, or VOO.

Gauss Manual Risk Adjustments
The only remaining sector to be filled is VNQ and I have a limit order in to pick up another 35 shares.
Gauss Performance Data
Since 12/31/2021 the Gauss managed to outperform SPY, the benchmark for the ITA portfolios I track. As readers can see, the S&P 500 is the most difficult benchmark to beat.

Gauss Risk Ratios
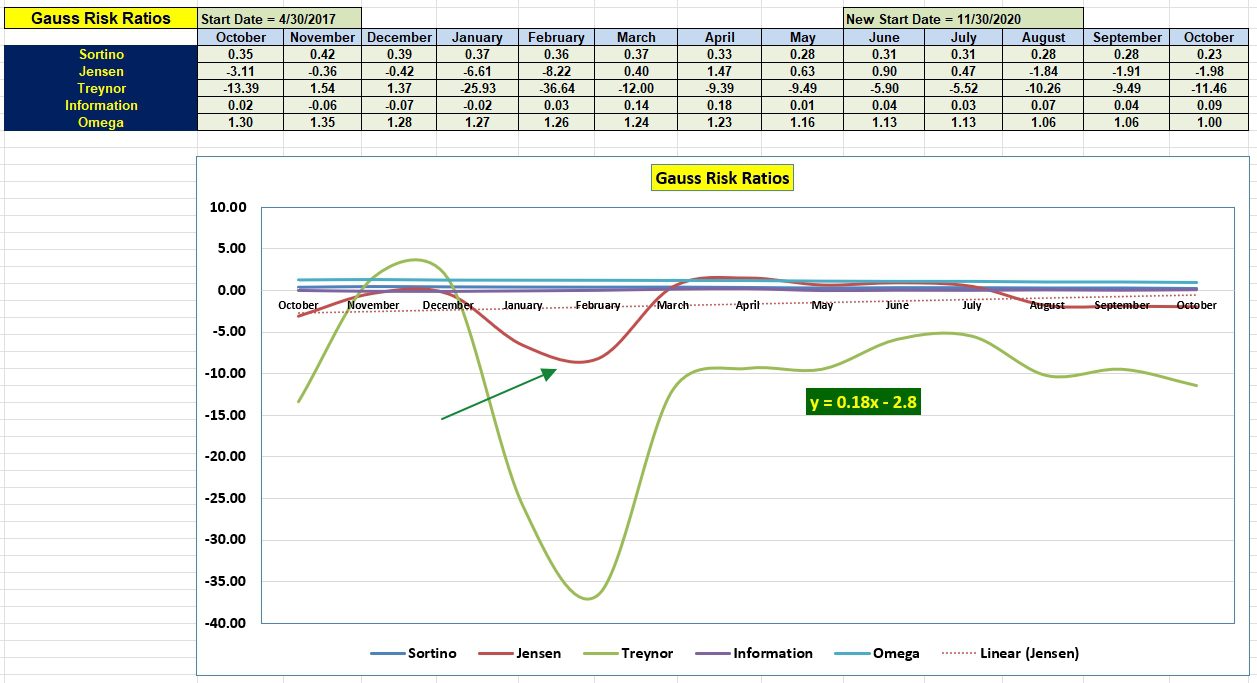
Despite besting the SPY benchmark the Jensen Performance Index is still negative. Much of the reason is related to the high interest rate for the risk-free treasury. I use the interest rate for SHV and it is currently 3.93%. In addition, a beta of 0.88 is on the high side considering all other factors in this market environment.
The current slope (0.18) of the Jensen is positive and seeing the historical values, it should remain positive over the next few months.
Gauss Portfolio Update: 19 March 2023
Discover more from ITA Wealth Management
Subscribe to get the latest posts sent to your email.
Could you direct me to where it explains how stop loss calculations are determined in the Kipling spreadsheet?
David,
I’m traveling right now so my answer will not be complete. Hope Hedghunter sees your question as he will provide a complete answer.
Here is my partial answer. Within the Kipling spreadsheet is a worksheet (forget the name) that comes just before the Manual Adjustment worksheet shown above in this blog post. Within that worksheet I adjust the SD Multiplier (Standard Deviation) so VTI is 8%. I use VTI as it is a broad U.S. Equities ETF. The 8% value is a personal figure that goes way back to when I read William O’Neil’s first book. He frequently spoke about setting Stop Loss limit orders of 8% below the purchase price of a stock so as to limit losses. That 8% recommendation stuck with me and that is why I use the 8% limit.
I’ll let Hedgehunter fill in gaps in my answer.
Lowell
David,
The stops, as calculated in the Kipling Workbook, are “Volatility” stops – i.e. the distance from current price is based on the asset’s volatility and will be closer to the current price for lower volatilty assets (e.g. bonds) than for higher volatility asses (e.g. equities).
Therefore the first step is to calculate the volatility of each asset with volatility taken as the standard deviation of daily returns. The period over which volatility is measured is selectable (in Cell H14) with the default value set at 63 (trading) days – or 3 months – and this is annualized for purposes of normalization (Annualized Volatility Column).
The distance of the stop from current price is then calculated (Volatility Stop Column) based on the distance (in Standard Deviations – Cell J14) that the investor may deem appropriate. It will also depend on how long the investor wishes the stop to be appropriate going forward. By default this is set at 21 days (one month) based on anticipated review period separation. The next Column (Stop Value) simply subtracts the “Volatility Stop” from the current price to provide the actual price at which the price might be placed. For investors using a platform that might accept %stops (particularly for TSLOs) the %stop is calculated in the next column (Stop Loss). And, finally, the probability of the stop getting hit is calculated in the last column of the area with a yellow background (Probability of Stop).
I hope this helps you understand how the stop loss values are calculated/determined and the flexibility the spreadsheet provides to meet an investor’s preferences and/or needs. Lowell has provided an example of how he likes to adjuster the SD input parameter to generate stop levels based on his personal preference for an 8% stop for equities – with other assets adjusted accordingly depending on their volatility and the SD distance chosen. Probabilities will also change as SD is changed.
Please ask for further clarification if still not clear.
David