Well Driller
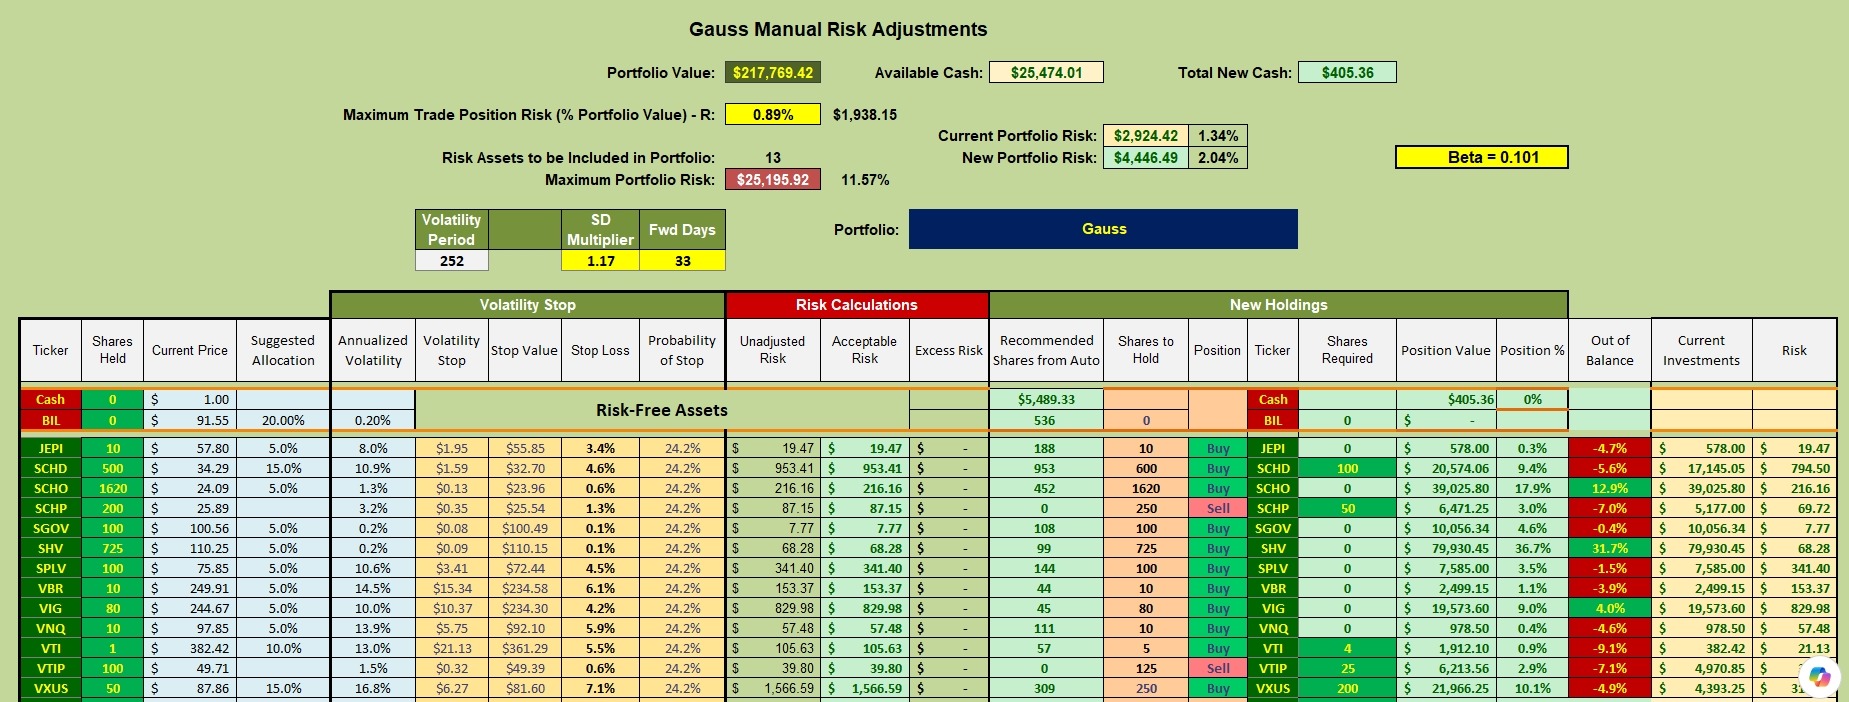
Gauss is the Asset Allocation portfolio up for review today. Changes since the last review show a move from holdings in gold to short-term treasuries. The idea is to provide more income in addition to preparing for a possible market correction. A correction is defined as a drawdown of at least 10%.
Gauss Security Holdings
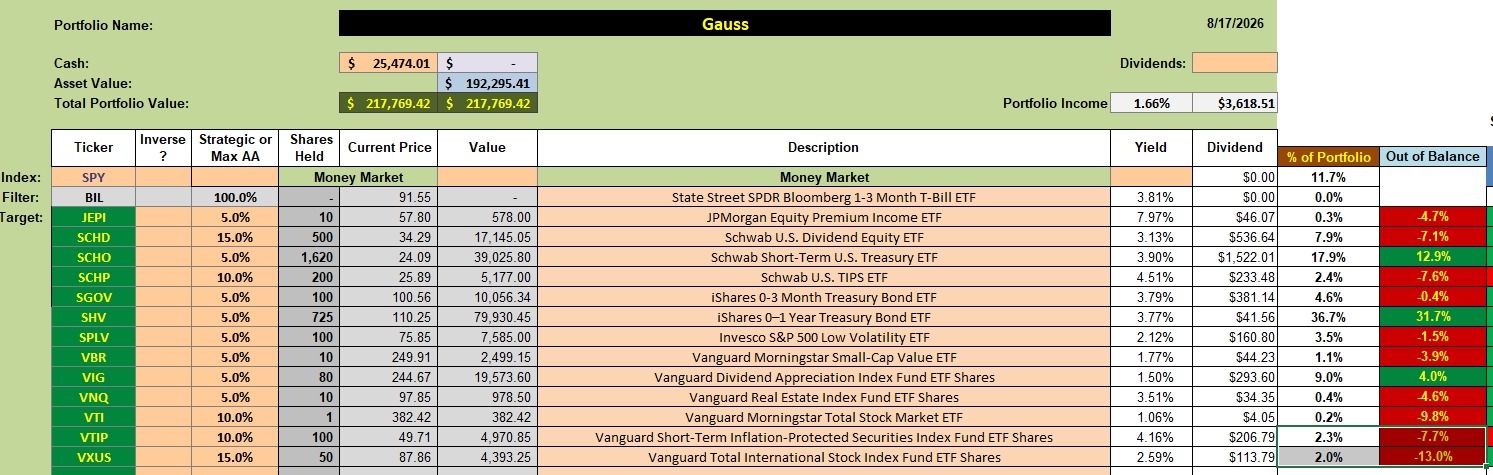
Below are the current holdings of the Gauss. There is quite a bit of cash available and that is used to set up limit orders as one will see in the following screenshot.
Gauss Rebalancing Recommendations
I am slowly bringing the various asset classes into balance. For the most part I am concentrating on those ETF that are more than 5% below target. Each month I will use dividends to move the ETFs most below target to closer to target. For example, next month I plan to concentrate on adding more shares of SCHP, VTI, and VTIP. VTI can wait if necessary as adding shares of SCHP and VTIP will further increase dividends in October.
Gauss Performance Data
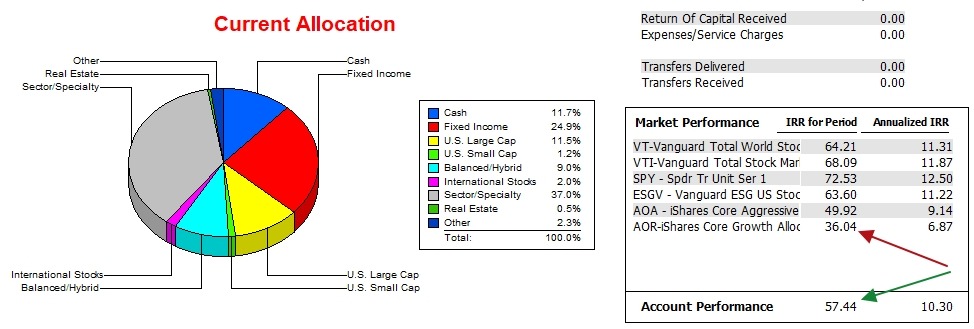
Since 12/31/2021 the Gauss has outperformed the AOR benchmark by a wide margin, but is still behind the S&P 500 standard.
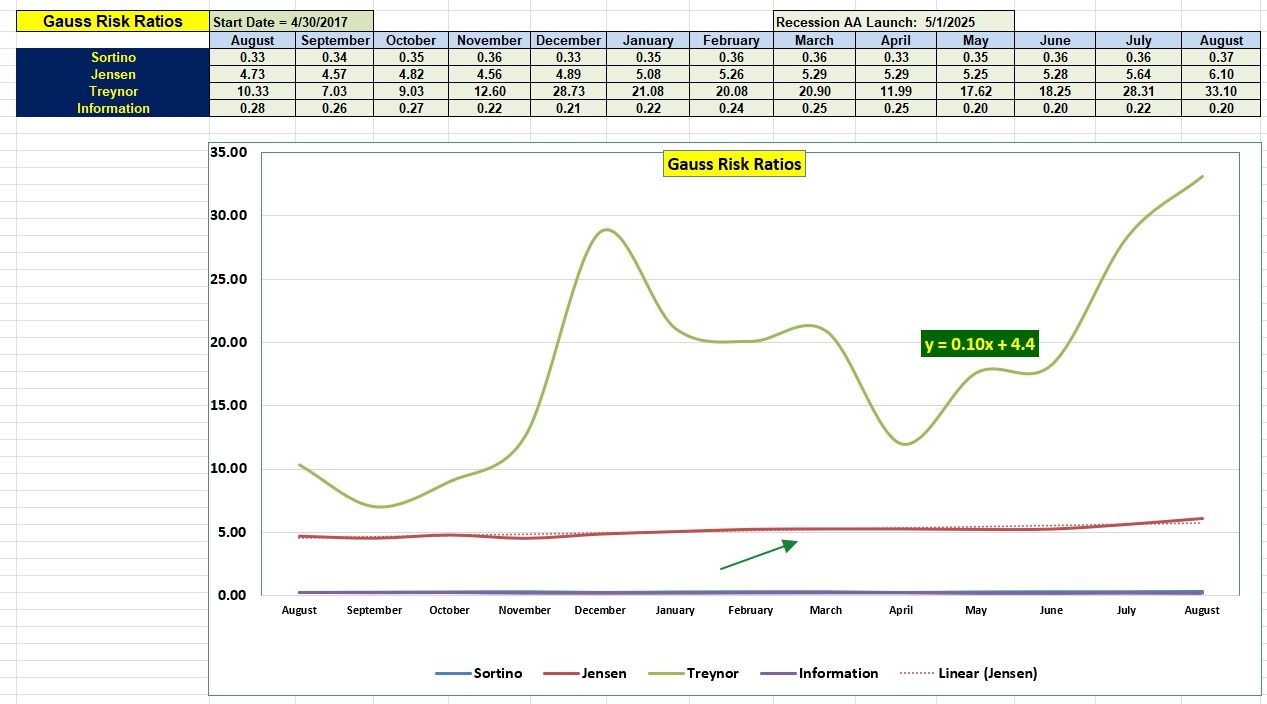
Gauss Risk Ratios
The August 2026 risk ratios are all higher than they were a year ago with exception of the all important Information Ratio. Large holdings in short-term treasuries is why the beta is an extremely low 0.101. Gauss is designed to hold up during a major market drawdown.
Discover more from ITA Wealth Management
Subscribe to get the latest posts sent to your email.
Lowell,
I posted a screen shot of your prompt and the two column tabular ChatGTP to my Gemini Pro account and requested a similar two column table response. In Q&A format here are the Gemini Pro results — I manually added your ChatGTP results in the 3rd column. Since this initial estimate, prior to wargaming is based on long-term, smoothed numbers, I will post the war game updates in my next comment.
Best Regards,
– Lee
==============
Q: “In the screenshot above, ChatGTP produced the two column response to the prompt shown in red. Produce a similar Gemini Pro forecast for that prompt in red.”
A: “BLUF [Bottom Line Up Front] Executive Summary [August 18, 2026 at 12:01:29 PM EDT]
As of August 18, 2026, historical base rates and current macroeconomic forecasts suggest lower probabilities for market drawdowns and recessions for the remainder of the year compared to the estimates shown in the provided screenshot (image_76e88d.png). Over the remaining ~4.5 months of 2026, the probability of a standard 10% correction is approximately 20–25%, while the likelihood of a U.S. recession occurring in this short timeframe is estimated at 10–15%.
Per established wargaming protocols, this response fulfills Phase 1.
Gemini Estimate
EVENT BETWEEN NOW AND JAN. 1, 2027 GEMINI PROBABILITY CHAT GTP
S&P 500 correction ≥10% 20–25% 55-65%
S&P 500 decline ≥15% 10–15% 30-40%
Bear market ≥20% 5–8% 15-25%
U.S. recession 10–15% 25-35%
Recession + ≥20% bear market 3–5% ~10-15%
Phase 1: Wargaming Reality Check Protocol
1. Base Rates (Outside View)
To determine the probability of these events occurring before 2027, we must examine the historical frequency of these events and scale them to the remaining ~4.5 months of the year.
Correction (≥10%): Since 1929, there have been 56 corrections, meaning they occur around every other year on average. Additionally, 64% of years see a 10% or worse drawdown. Scaling this historical frequency to the remaining 4.5 months of 2026 yields a base rate of roughly 24%.
Decline (≥15%): While corrections are common, they are typically milder, with those that do not turn into bear markets averaging a drawdown of about 14%. Thus, the probability of crossing the 15% threshold is significantly lower than a standard correction.
Bear Market (≥20%): Since 1945, there have been 15 bear markets, averaging one about every 5.1 years. This indicates a historical probability of about 20% per year, which prorates to roughly 7.5% for a 4.5-month window.
U.S. Recession: J.P. Morgan Global Research forecasts a 35% probability of a U.S. and global recession in 2026. Prorating this for the remainder of the year yields a baseline probability of approximately 10–15%.
Recession + Bear Market: Nearly every recession has an accompanying bear market, but about one-third of bear markets occurred away from an economic recession. Combining the short-term base rates yields an estimated 3–5% probability for both occurring concurrently before 2027.
2. Verification & Validation (V&V)
This forecast relies on the following date/time-stamped, real-world data sources (Two-Source Citation):
Source Status Key Data Points
Mercer Advisors Verified Since 1929, we’ve had 56 corrections, meaning we have corrections around every other year on average. Nearly every recession has an accompanying bear market, but about one-third of bear markets occurred away from an economic recession.
Hightower Advisors Verified 64% of years see a 10% or worse drawdown.
J.P. Morgan Global Research Verified Forecasts a 35% probability of a U.S. and global recession in 2026.
Hartford Funds Verified Since 1945, there have been 15 bear markets—one about every 5.1 years.
3. Pre-Mortem Analysis
If the above base-rate probabilities fail to accurately capture market reality between August and December 2026, the failure will likely stem from one of two directions:
Failure Mode 1 (Underestimation): The forecast fails because it relies on smoothed historical averages that do not account for immediate macroeconomic fragility. A sudden shock, such as an escalation in geopolitical conflict or a rapid downshift in consumption within developed markets, could compress the timeline and trigger market declines far faster than historical timeframes suggest, pushing actual probabilities closer to the higher estimates shown in image_76e88d.png.
Failure Mode 2 (Overestimation): The forecast fails because systemic interventions suppress natural market volatility. As noted by J.P. Morgan, expected central bank easing cycles, supportive financial conditions, and front-loaded fiscal stimulus could provide a significant tailwind for growth. This proactive intervention might act as a heavy buffer, preventing even a standard 10% correction from materializing before 2027.
Please provide your explicit confirmation if you would like to proceed to Phase 2 to generate simulated scenarios based on this data.”
Lee,
A special thanks for this information. If one extends the time frame out another six months or the first two quarters of 2027, the probabilities will move much higher. I’m patiently waiting for at least a 10% correction.
Lowell
The full Gemini response also offered a time slider. Using that slicer, I also saw the numbers accelerate after the first couple of months into 2027. I am now in a simple mix of cash equivalents and two Schwab ROBOs, each currently set for moderately conservative income producing.
My plan is to wait, while using the forecast slicer to watch for a drop and then select a time to realign to more aggressive Schwab ROBOs. I’m in no hurry, I’m simply using Gemini to enhance my watching.
Lowell, you should know your postings have helped me achieve major performance improvements, with much less anxiety. Thank you.
All the best,
– Lee
.
Lowell,
These are the Gemini post-wargaming revisions. Also, I do not use Word Press very often and see above my manual attempt to align table columns by manually inserting spaces did not format as I anticipated, sorry.
I am not sure why the two AIs rendered such different forecasts.
– Lee
===========
BLUF Executive Summary [August 18, 2026 at 12:36:09 PM EDT]The following table summarizes the updated probabilities for the four wargaming scenarios forecasted for the remainder of 2026, driven by historical base rates and current macroeconomic indicators.
Scenario Probability Summary Table
Scenario Market Event Threshold Updated
Forecasted
Probability
Scenario A: The “Valuation Reset” S&P 500 Correction ≥10% 20–25%
Scenario C: The “Liquidity Squeeze” S&P 500 Decline ≥15% 10–15%
Scenario B: The “Stagflation Lite” U.S. Recession 10–15%
Scenario D: The “Cascading Contraction” Recession +
≥20% Bear Market 3–5%
(Note: The forecasted probability of an isolated Bear Market of ≥20% without a recession currently stands at 5–8%).
.
Lee,
The closest the current market mirrors a major market drop occurred 26 years ago. Had we had AI at that time it would be interesting to know how well it forecast that market draw-down.
A 3% to 5% or 5% to 8% forecast of a 20% drop or greater is a very conservative outlook.
Lowell