
Carr Fire – Shasta, California
Gauss just passed birthday number one as a Sector BPI portfolio. How well has the portfolio performed vs. the S&P 500 on both an absolute scale (Information Ratio) and a risk adjusted basis(Jensen Performance Index)? Both measurements are important. The following analysis will answer these questions.
About a year ago I was dissatisfied with the performance of the Gauss so I switched to the Sector BPI investing model, not knowing for sure how this change would impact the portfolio. There was little history to build on other than the hypothetical logic that the model made good sense. Good sense is little to go on when working with investments. Since the Sector BPI model is nearly impossible to back-test about all one can go on is to make the leap and begin to test the model using real money and build the case month by month. That is what is now going on with 13 different portfolios, eleven (11) I review at least every 33 calendar days here on the ITA blog.
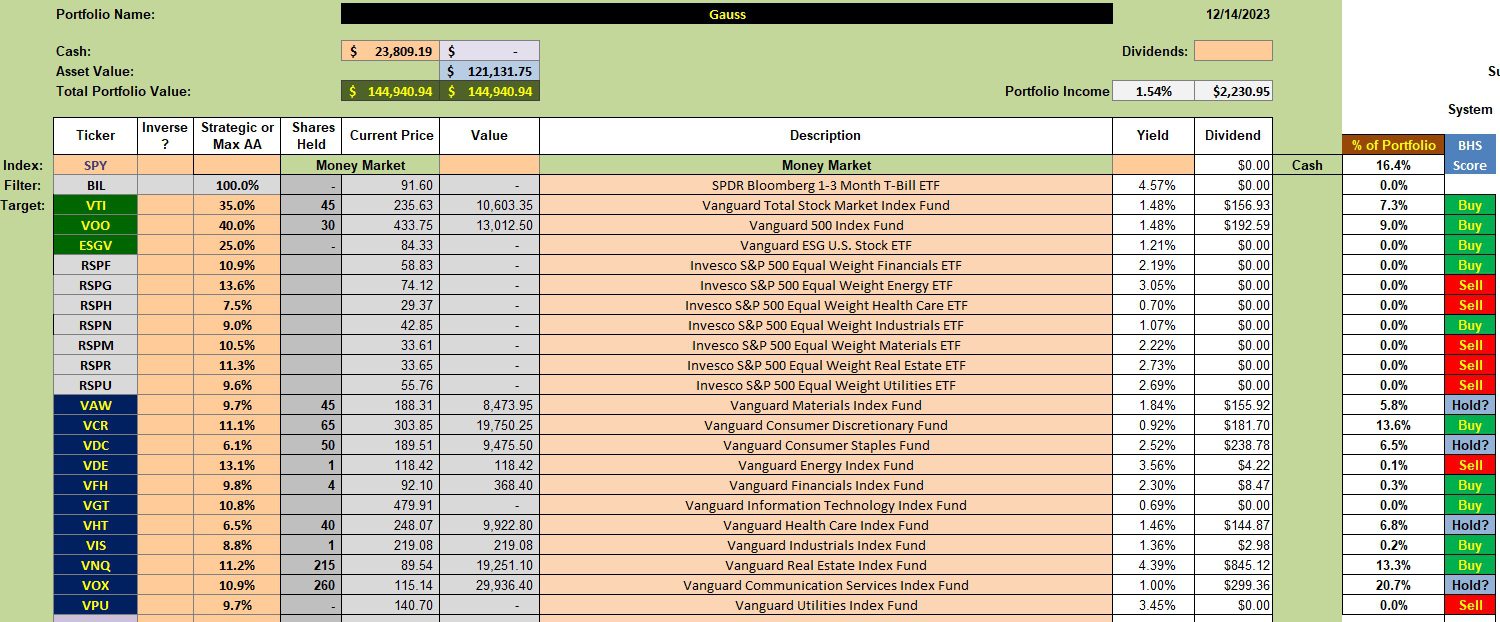
Gauss Investment Quiver and Holdings
Below is the investment quiver for the Gauss and the current holdings. Note that I am including equal-weight ETFs or those that have a superior five-year performance record compared to the cap-weighted sector ETFs. I recently listened to several analysts argue that equal-weight indexes should outperform cap-weighted indexes in 2024. The Gauss is positioned to take advantage of this difference in the coming months.
I need to wait for the next buying signal before I can compare cap-weighted ETF with the equal-weight ETF. For example, should Financial show up as a Buy, I will compare RSPF with VFH to see which has the best five-year performance.
Gauss Performance Data
The latest uptick in the U.S. Stock Market moved the Gauss into positive territory and the SPY benchmark also moved into the black. The Gauss holds an advantage of nearly 1.5 percentage points over the S&P 500 ETF, SPY. The next question remains. Did Gauss gain, lose, or hold its own since the last review? We need to check the Risk Ratios table for this answer.

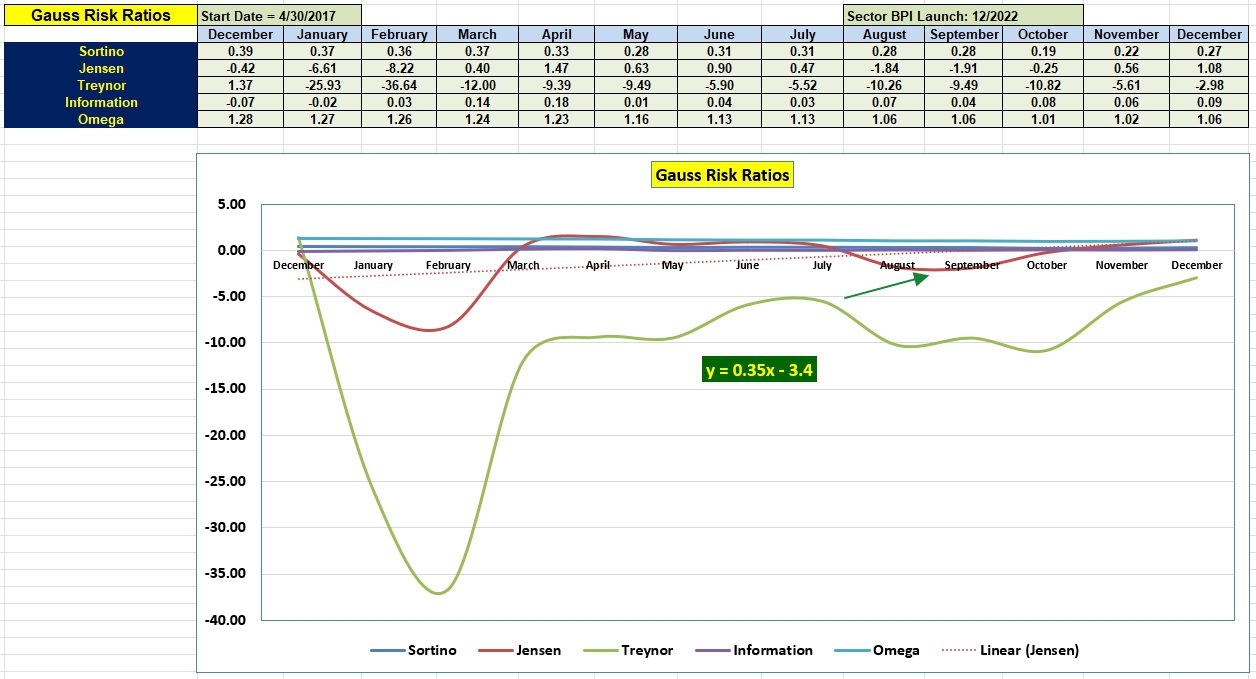
Gauss Risk Ratios
Since November the Gauss gained ground on every one of the five risk measurements. The Jensen Alpha (also known as Jensen Performance Index) is the highest since last April. The Information Ratio also shows steady growth since last April.
The slope of the Jensen is positive, another encouraging measurement for this portfolio.
What to do with the excess cash? I plan to set limit orders to pick up shares of ESGV and VOO, the two highest ranked U.S. Equity ETFs.
Gauss Portfolio Update: 19 March 2023
Discover more from ITA Wealth Management
Subscribe to get the latest posts sent to your email.
You must be logged in to post a comment.