
Oregon Vineyard
Wow! What a good day for U.S. Equities. How did the Carson portfolio, one of 13 Sector BPI accounts, perform compared to the S&P 500? When last check the BPI data six sectors were overbought. They are: Financial, Health, Industrial, Technology, Utilities and Real Estate. I don’t think all the BPI data for today is in so I will check the stats tomorrow morning. I expect Discretionary and Materials may join the six currently holding TSLOs.
Carson Security Holdings
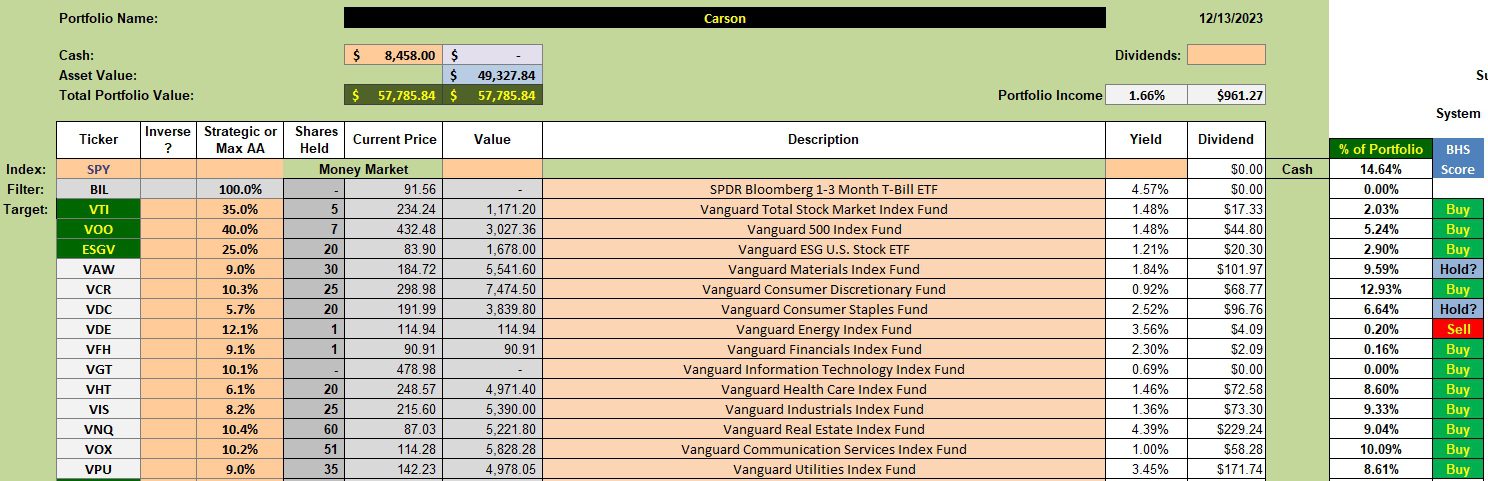
Below are the current ETF holdings in the Carson portfolio. With the sale of Technology we built up a bit of cash. The portfolio would have performed even better had we been able to hold on to VGT, but those are the risks one takes with any mechanical model.
Carson Performance Data
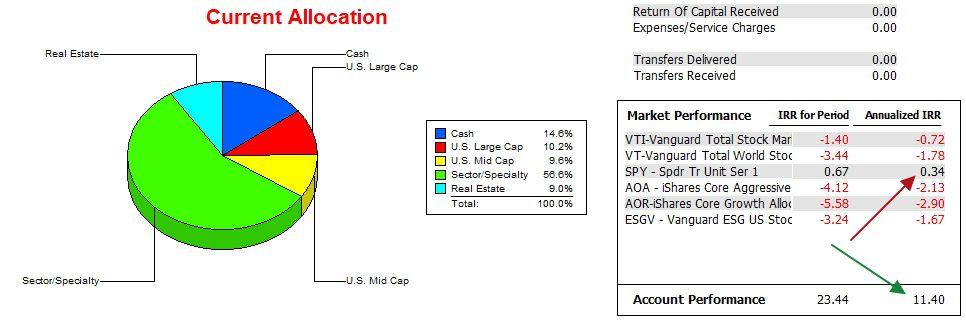
We are coming up on two years of operation for the ITA portfolios and the Carson is one of the leaders with an IRR of 11.4% while the S&P 500 ETF (SPY) returned 0.34%. This is a huge difference. Of particularly importance is that the Carson is the oldest Sector BPI portfolio so it is giving this new model an excellent recommendation.
Carson Risk Ratios
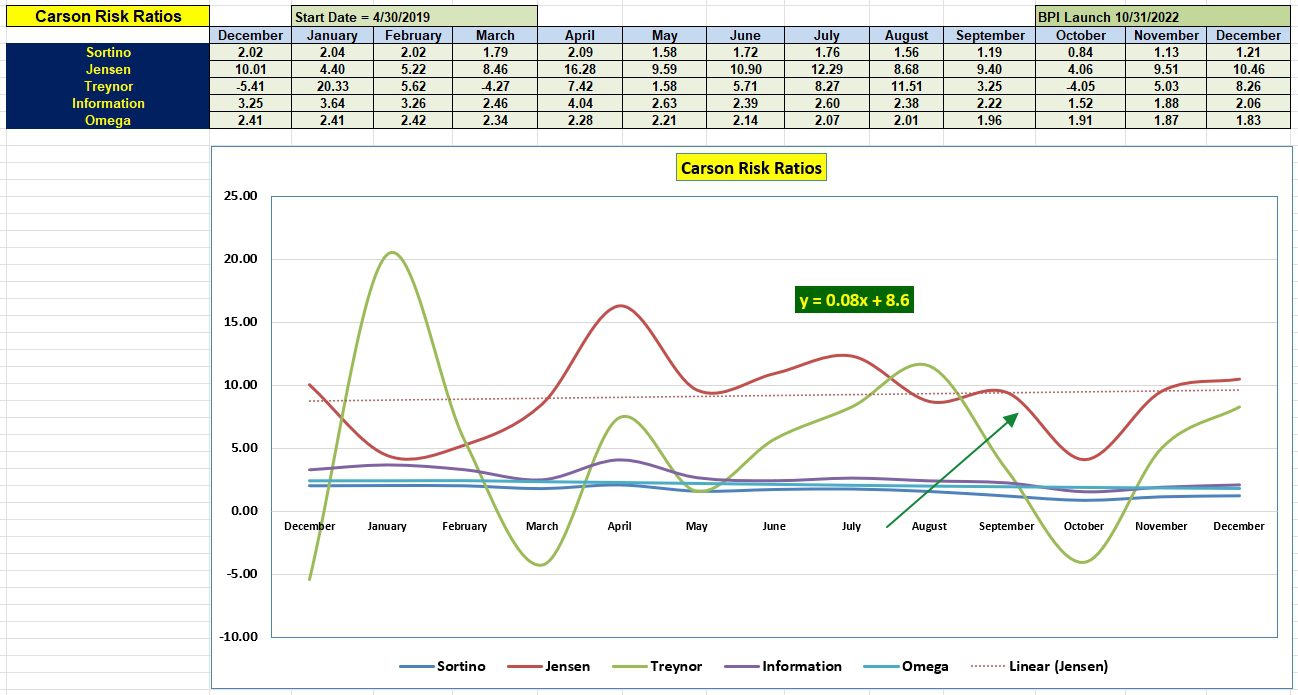
When we experience a strong market, as has been the case over the past six weeks, I get a tad nervous as I wonder how well is the portfolio performing compared to the benchmark. I continue to use the tough S&P 500 as the benchmark. It came as a bit of a surprise to see the Jensen and Information Ratios gain ground on their November scores. That is excellent news.
For the first time in many months the slope of the Jensen Performance Index squeaked into positive territory.
Carson Sector Portfolio Performance
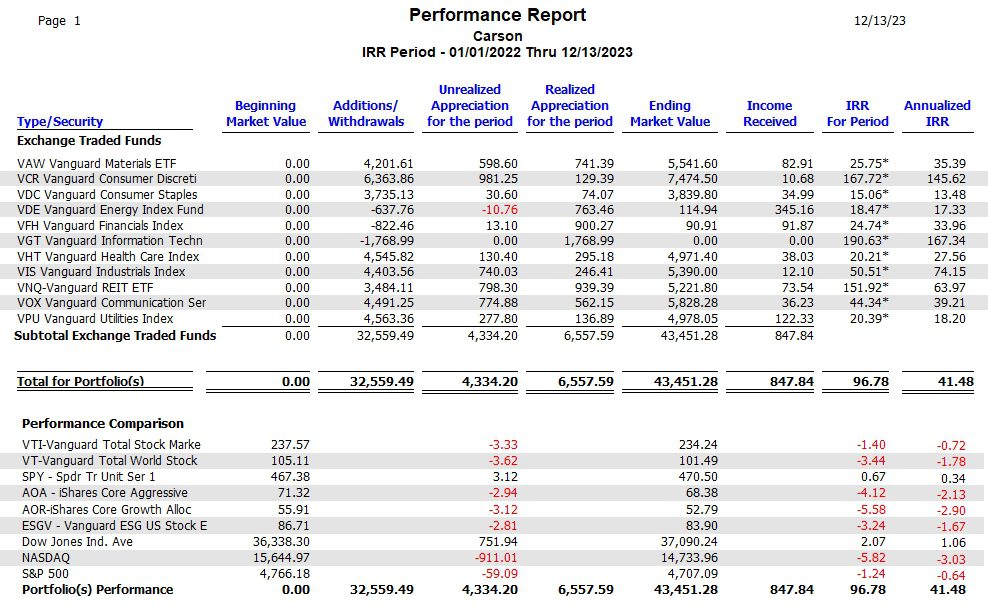
After nearly two years of operation, how is the Sector BPI model holding up. If one only used sector ETFs the Annualized IRR for the Carson is 41.5%. Since the portfolio also held shares of equities such as VTI, ESGV, VOO as well as other ETFs over this period, the IRR is much lower. I’m posting the following information as a way to evaluate the Sector BPI model. Once more, we have not experienced many Buy/Sell cycles. We need more experience, but each month we add more data the better this model looks. I still consider the Sector BPI model to be in the hypothesis stage of development.
Tweaking Sector BPI Plus Model: 20 May 2023
Tweaking Sector BPI Plus Investing Model: Part II
Franklin Portfolio Review: 21 July 2023
Millikan Sector BPI Update: 20 July 2023
Gauss Portfolio Update: 19 March 2023
Pass on the ITA link to folks you think might find this information useful. Tell them to sign up as a Guest and wait to be elevated to the Platinum level. This blog is now free to all who register as a Guest.
Discover more from ITA Wealth Management
Subscribe to get the latest posts sent to your email.
Lowell,
Yes VHT and VCR crossed over yesterday. Can you post your recommended TSLO %’s?
Thanks,
Bob W
Bob,
I just checked the BPI data and VCR hit the 75.9% bullish level. Therefore I would place a 2.4% TSLO on VCR. Health (VHT) reached the 80.3% bullish level so I would place a 2% TSLO on VHT.
Lowell
Back in early November of 2022 I asked the question of the Carson portfolio, can one expand the delta when comparing the portfolio performance with the SPY benchmark?
On Nov. 4th of 2022 the separation between the Carson and SPY was 1.43% points annualized. Today it is 11.4% points annualized. Another box checked that the Sector BPI model is working.
Lowell