
Evening Light – Newport Bay
Millikan is the Asset Allocation portfolio up for review this morning. I added SCHD as another dividend oriented asset knowing there is overlap with VYM and VIG. Dividends are used to keep asset classes in balance. Since cash is at a premium and I don’t plan on selling existing holdings, I’ll wait for any infusion of new cash and dividends to beef up SCHD as it is well under target.
Before exiting this page, be sure to check out the Shiller PE Ratio and Buffett Indicator at the bottom of the page. Both are in “nose bleed” territory. Time to be cautious.
Millikan Security Holdings
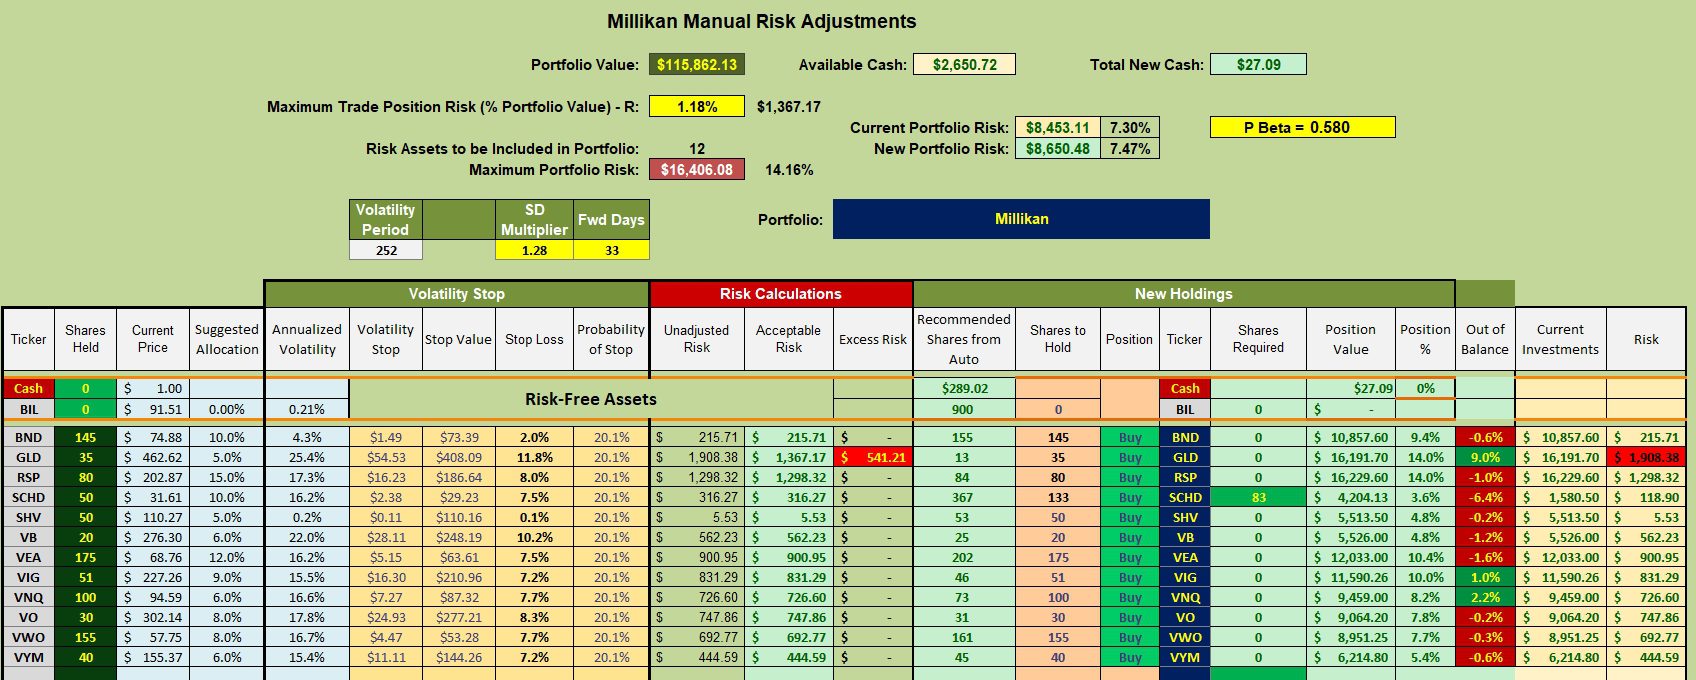
Below are the current holdings within the Millikan. In the current market environment I am wary when it comes to holding this many equity oriented ETFs. I have several Trailing Stop Loss Orders (TSLOs) in place and plan to set more, despite not highly in favor of this method for protecting capital. Other than moving to low volatile securities, TSLOs seem to be one of the better ways to avoid a major correction or recession. Right now the top 20% of earners are keeping the stock market near or at all-time levels. Yes, the market continues to climb the proverbial “Wall of Worry.”
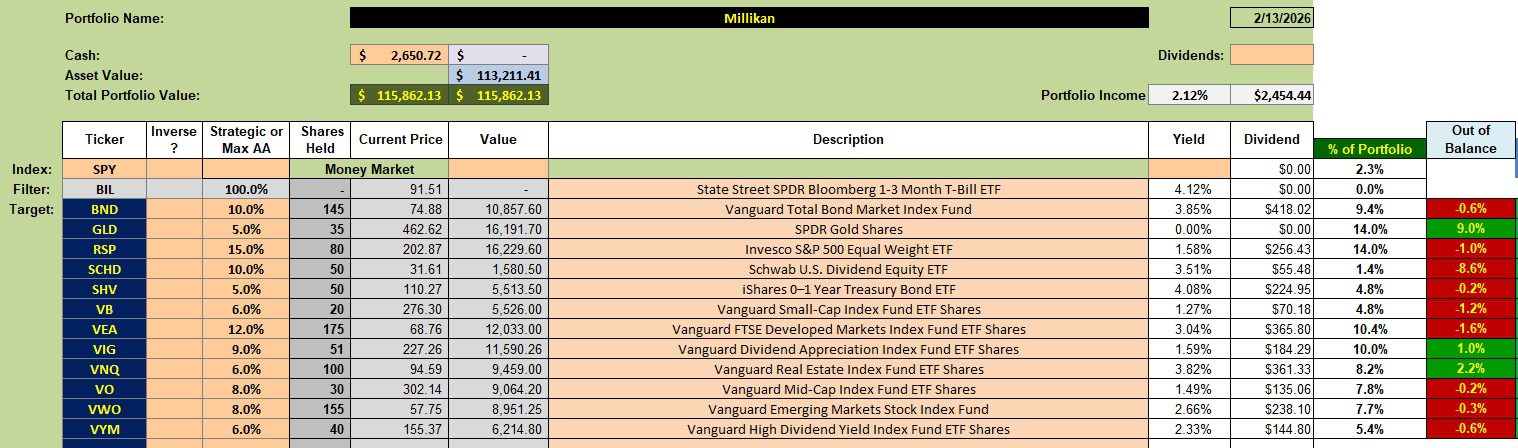
Millikan Rebalancing Recommendations
The goal is to eventually bring all asset classes within one percentage point of the targets. This will take time unless the owner pumps a lot of new cash into the account. At the moment, all attention is focused on SCHD.
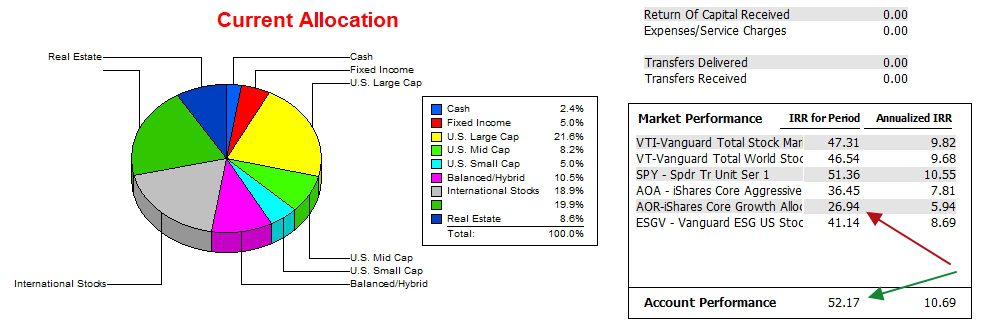
Millikan Performance Data
Since 12/31/2021, or over the past four years, the Millikan has managed to outperform all tracked benchmarks. The race is a squeaker with SPY, but more than double the AOR benchmark. This data comes from the commercial program, Investment Account Manager. I highly recommend using this software to track portfolio performance. I’ve been using the program since the DOS days.
Once more, 20% of the portfolio shows up as unrecognized. Some of this may be dividend oriented ETFs.
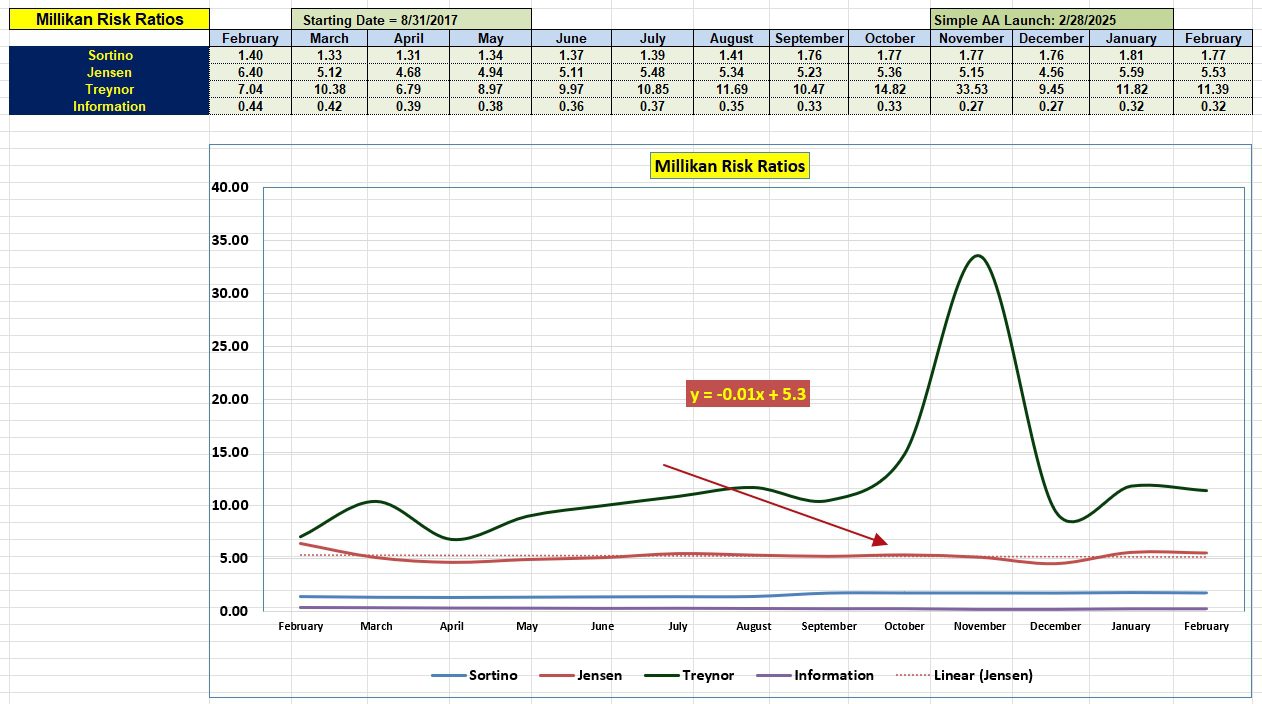
Millikan Risk Ratios
All the risk ratios are off their January values. January was a kind month to the Millikan and yet the slope of the Jensen Alpha is still negative.
Shiller CAPE Ratio: Check out the Shiller PE Ratio as it is near an all-time high.
Buffett Indicator: The Buffett Indicator is 2.4 standard deviations above normal.
Discover more from ITA Wealth Management
Subscribe to get the latest posts sent to your email.
Leave a Comment or Question