
Joshua Tree National Park
Pauling is the portfolio up for review today. Pauling joined the Sector BPI investing model last October. Readers can see how well this model worked over the past four months in the fifth screenshot below. Four months is a very short time in the investing world so pay more attention to trends vs. absolute growth values.
No sectors are oversold so we look to equities for investment opportunities. I added Developed International Equities (VEA) and Emerging Market Equities (VWO) to the investment quiver to provide more diversification.
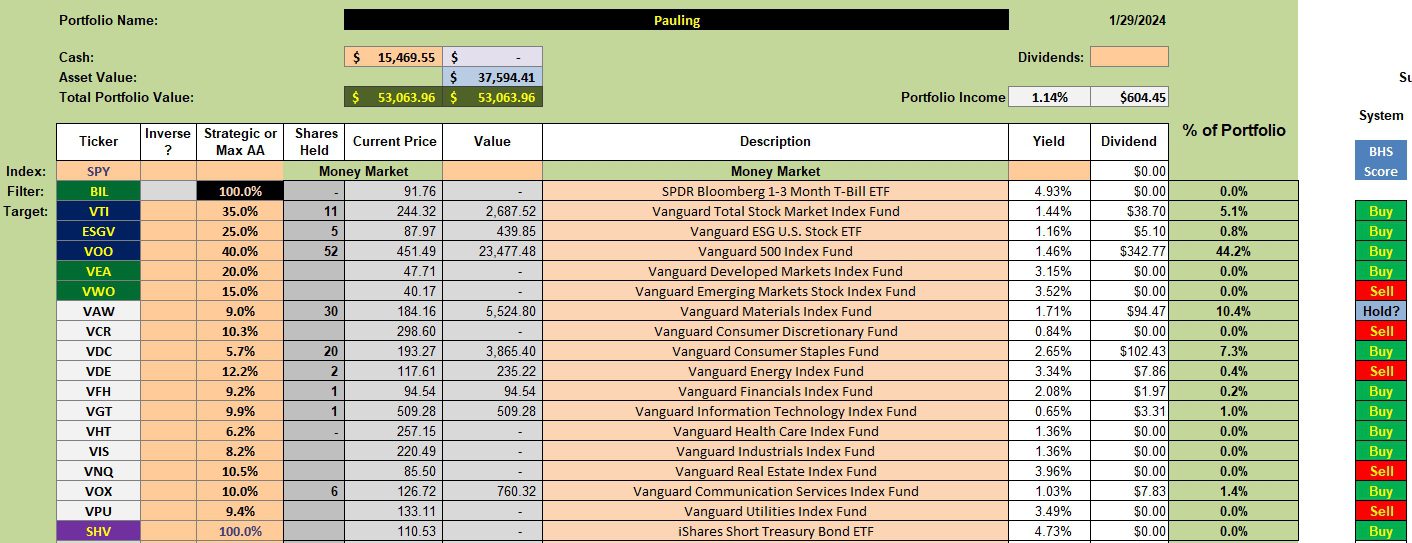
Pauling Security Holdings
The Pauling continues to hold a few sector ETFs as TSLOs have not been set or prices have yet to be struck. VEA is now a Buy, but no shares are recommended as ESGV ranks much higher. All three U.S. Equities (VTI, VOO, and ESGV) are a Buy.
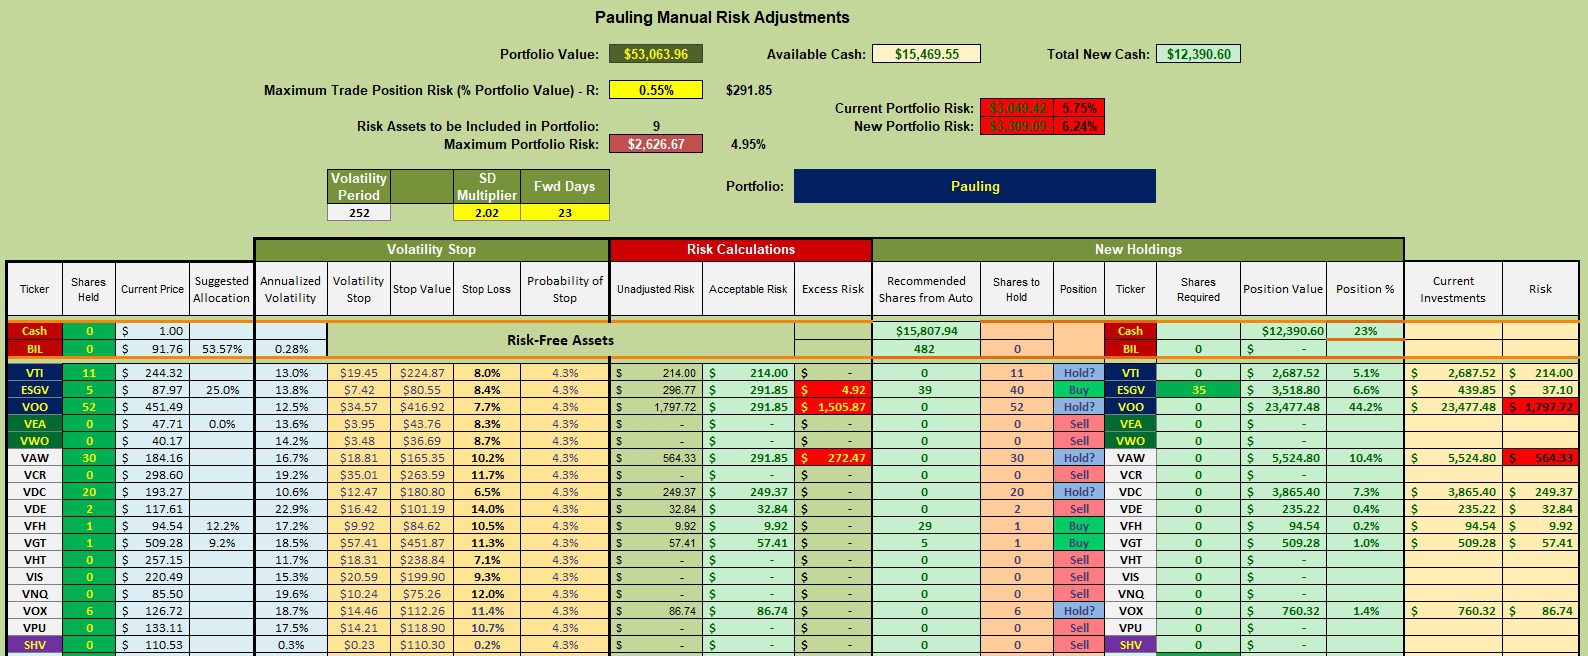
Pauling Manual Risk Management
The single ETF “requiring” more shares is ESGV. Limit orders are in place to fill this recommendations. Since beginning this blog, one ESGV limit order hit the buy price.
No other changes are recommended so the Pauling is close to static or in a holding pattern until the February review.
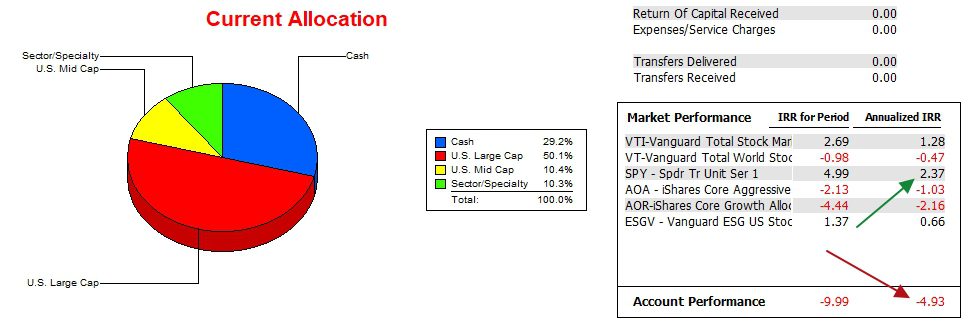
Pauling Performance Data
With 24 months of data in the vault the Pauling continues to lag the S&P 500 as well as all the other five benchmarks. This poor performance is one reason for switching the Pauling over to the Sector BPI investing model.
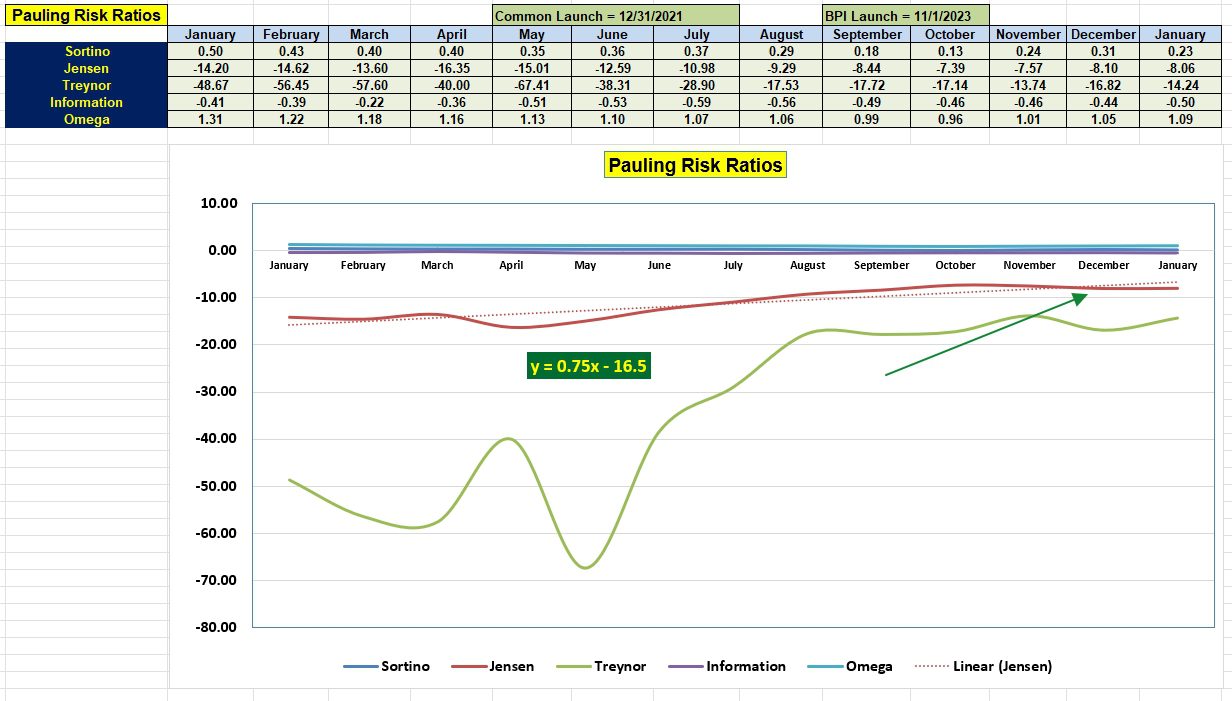
Pauling Risk Ratios
Checking the Jensen risk ratio we see slight improvement since December and based on the slope of the Jensen improvement is evident as we look back over the year.
Pauling Sector Portfolio Report
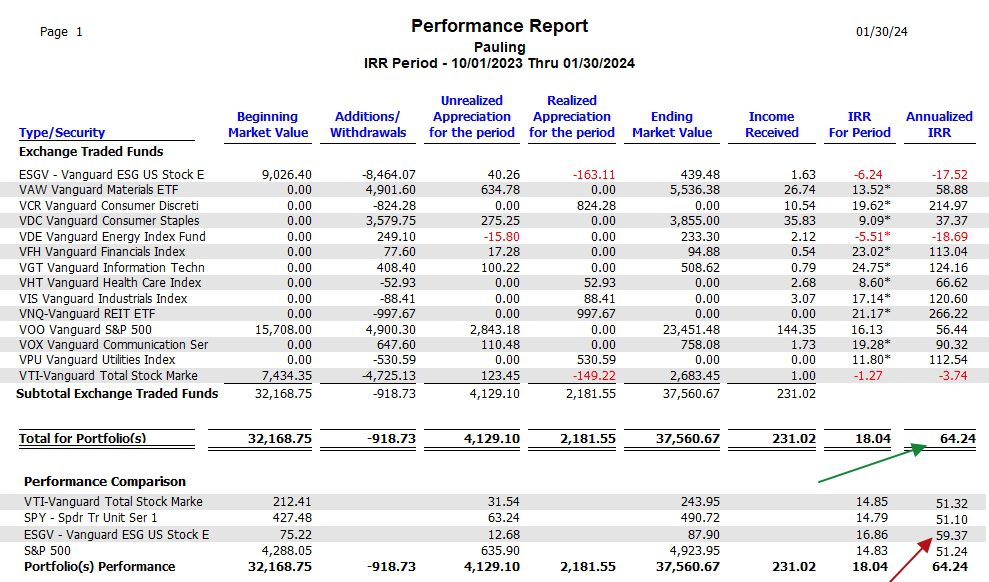
The following portfolio report is included to show readers how the sector ETFs are performing for the Pauling. As mentioned above, the Pauling did not hold any sector ETFs until sometime in October of 2023. Since October the securities held in the Pauling generated an annualized IRR of 64.2%. The real return is the IRR For Period is 18.0%. This is a slight improvement over the SPY benchmark (14.8%).
The total IRR for the Pauling is lower as the portfolio held cash and cash was a drag in overall performance.
Discover more from ITA Wealth Management
Subscribe to get the latest posts sent to your email.
Lowell,
I notice you set the SDF multiplier fairly high for this portfolio. Why?
Bob W.
Bob W.
I adjusted the SD Multiplier so the Stop Loss percentage for VTI is 8.0%. You may ask, why adjust the Stop Loss at 8.0%? That percentage goes back to something I must have read 30 or 40 years ago by William O’Neil. O’Neil recommended setting an 8% limit order or TSLO of 8% under every investment so as to reduce losses. That 8% figure just stuck with me and I’ve continued to use it for many years.
While I use the 3% TSLO for sector ETFs when a sector moves into the overbought zone, I set 8% TSLOs under equities such as VTI, VOO, and ESGV to reduce capital losses. Hope this makes sense.
Lowell