
Chinatown
Kepler is the portfolio up for review this morning. Over the last few months I’ve adjust the asset allocation in preparation for a stock market correction – or worse. One clue is to pay attention to the bond market as it is many times larger than the U.S. Equities market. China and Japan are no longer inclined to support our rising national debt. Thus far the equities market has held up better than anticipated.
I just checked all the market sectors. All are bullish with exception of Energy, Financial and Utilities. Energy and Technology are overbought while Materials is oversold. That is the broad overview at this date.
Kepler Security Holdings
The Kepler is overloaded with short-term treasuries (SCHO). I am patiently waiting for better buying opportunities.
The Kepler is well diversified as it holds gold, commodities, developed international equities, emerging market equities and several sectors consumers will need to survive regardless of market conditions. Granted, many of these asset classes are well below target.
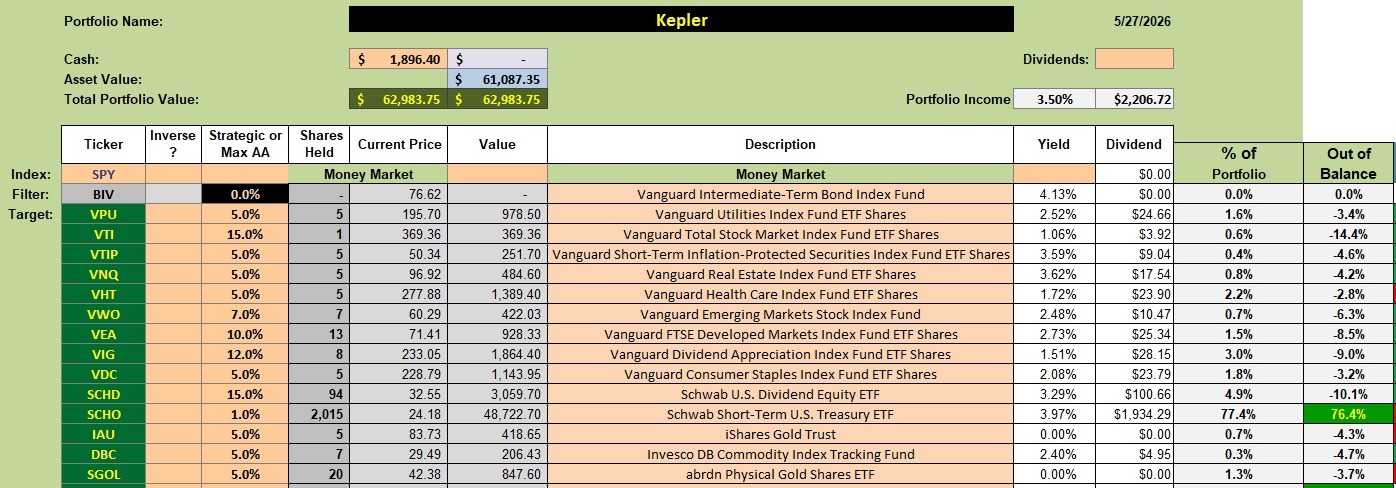
Kepler Rebalancing Recommendations
A few limit orders are in place to use up the available $1,800 currently held in cash. The limit orders are set well below the current price. When SCHO dividends show up I plan to place a few more limit orders, but I have no plans to sell shares of SCHO until there is at least a 10% dip in the broad market.
The current three-year volatility average of VTI is 12.3% so it would not be unreasonable to expect some sort of correction over the next few months. Remember that old adage – “Sell in May and go play.”
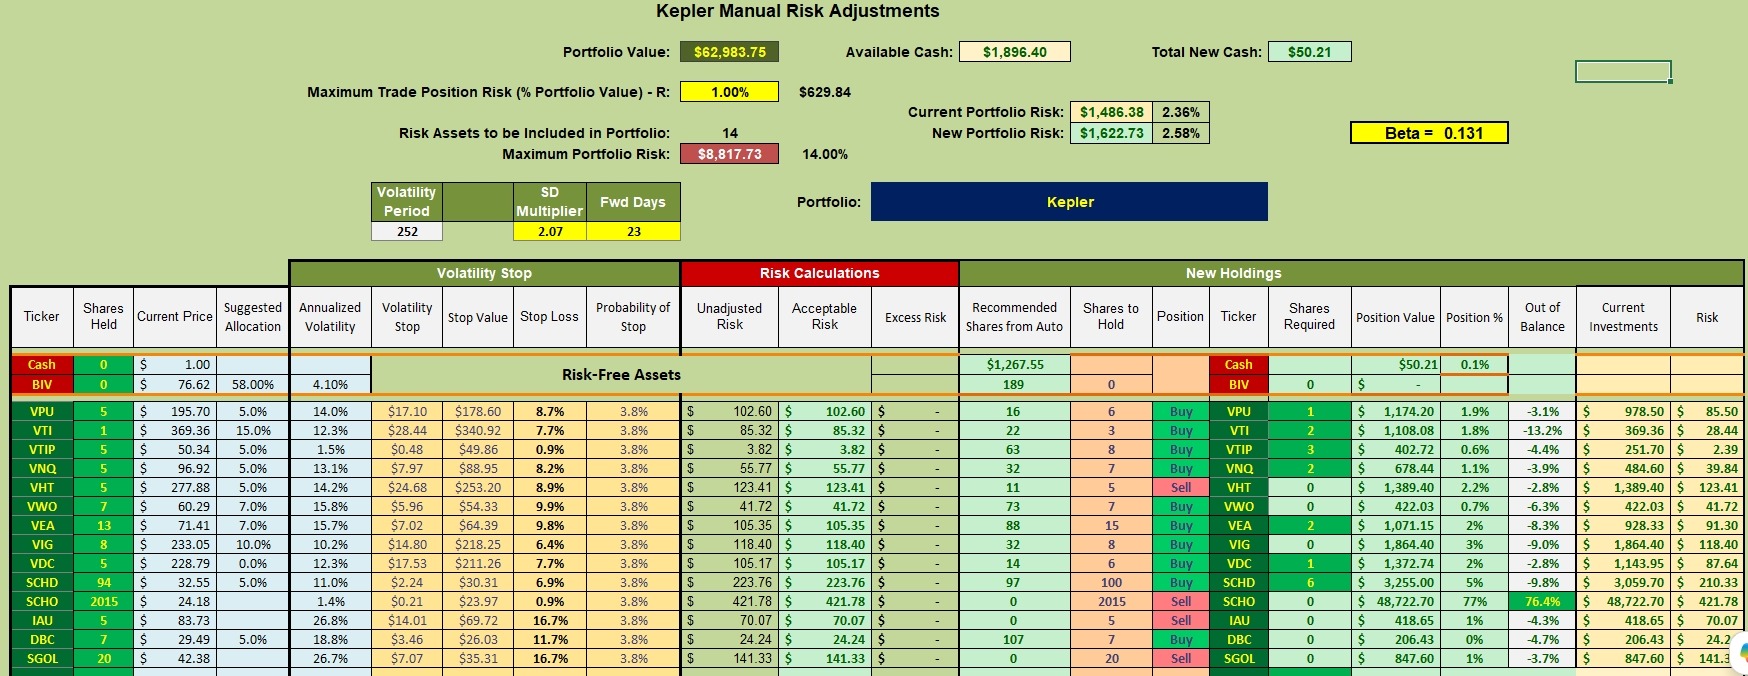
Kepler Performance Data
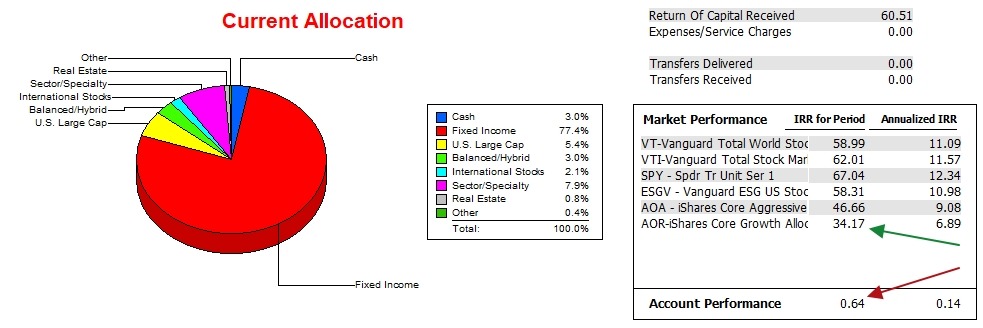
The 77% in fixed income is primarily the SCHO holding.
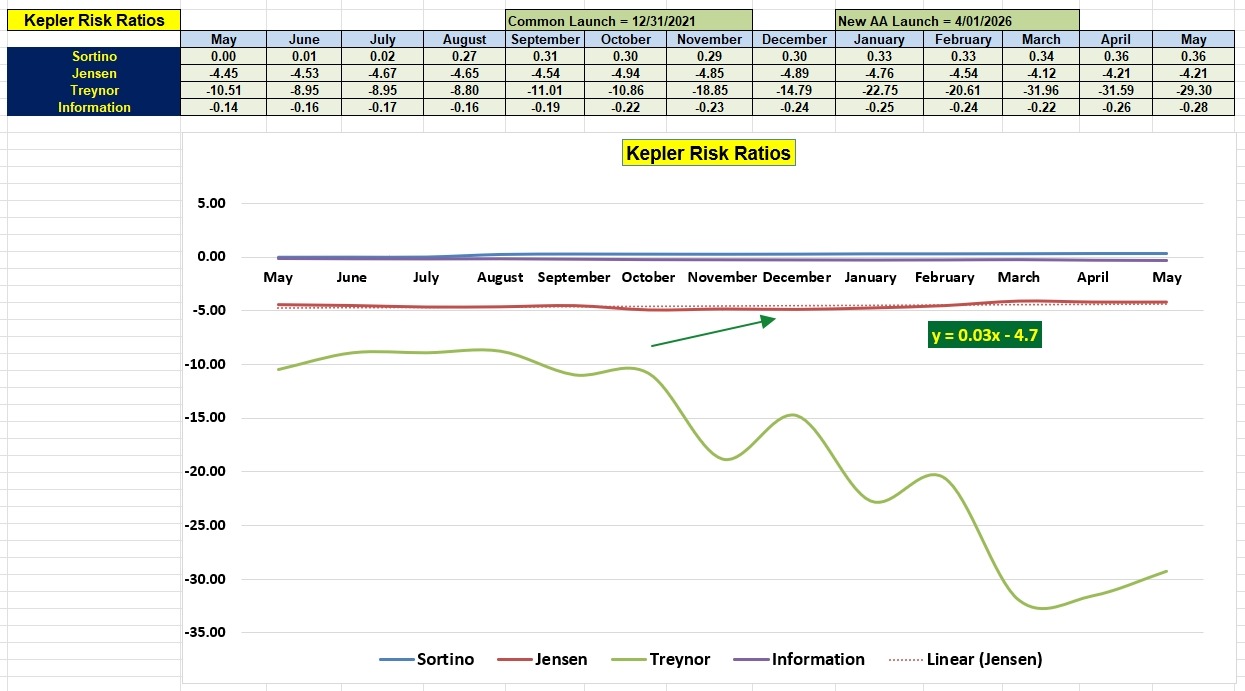
Since 12/31/2021 the Kepler has been one of the two or three worst performers here at ITA. I’ve provided some reasons in prior blog posts. At this point I look to the four risk ratio metrics to see what direction the portfolio is currently moving.
Kepler Risk Ratios
Over the past year the risk ratios are giving mixed signals. Based on the Sortino Ratio the portfolio is increasing in value, but giving way to the AOR benchmark as we see from the Information Ratio. A slight positive Jensen Alpha indicates the portfolio is improving slightly on a risk adjusted basis. None of the changes are dramatic.
The Kepler is currently set up to resist a draw-down, but will under perform if the equities market continues to trend upward.
Place your questions or comments in the space provided below.
Discover more from ITA Wealth Management
Subscribe to get the latest posts sent to your email.
Lowell, I’m unclear as to how to use the template. Do I download it and how do I decide how many shares I should purchase per EFT if I start with a 10k investment. Are you making the adjustments and I just follow your lead or is the intelligence built into the spread sheet? I have a Fidelity account and noticed they have a program called Fidelity Basket Portfolio that seems to function like your spreadsheets. Do you know if can be used to mimic your spreadsheet. I want to diversify from mostly T-bills to a segment of EFT’s and am looking at your portfolio’s to see what best suits me but want to be sure how I understand their use. Any feedback is helpful since I couldn’t find real clarity in the forum’s. Thanks JimN
Jim,
Are you referring to one of the Sector BPI portfolios? The three are: Carson, Franklin and McClintock.
Or are you referring to one of the Asset Allocation portfolios such as the Bohr, Kepler, Millikan, etc.?
Lowell
Jim,
Are you familiar enough with Excel or another style spreadsheet to create one from scratch?
When setting up an Asset Allocation style of spreadsheet one could follow something similar to the Schrodinger.
Another option is to ask ChatGPT to create a diversified portfolio using low expense ratio ETFs and to specify what percentage to invest in each. Then build a spreadsheet around the AI recommendations.
Lowell
Lowell/Jim,
Or, copy the Schrodinger ETFs and associated allocation percentages.
~jim