
Construction Consultation.
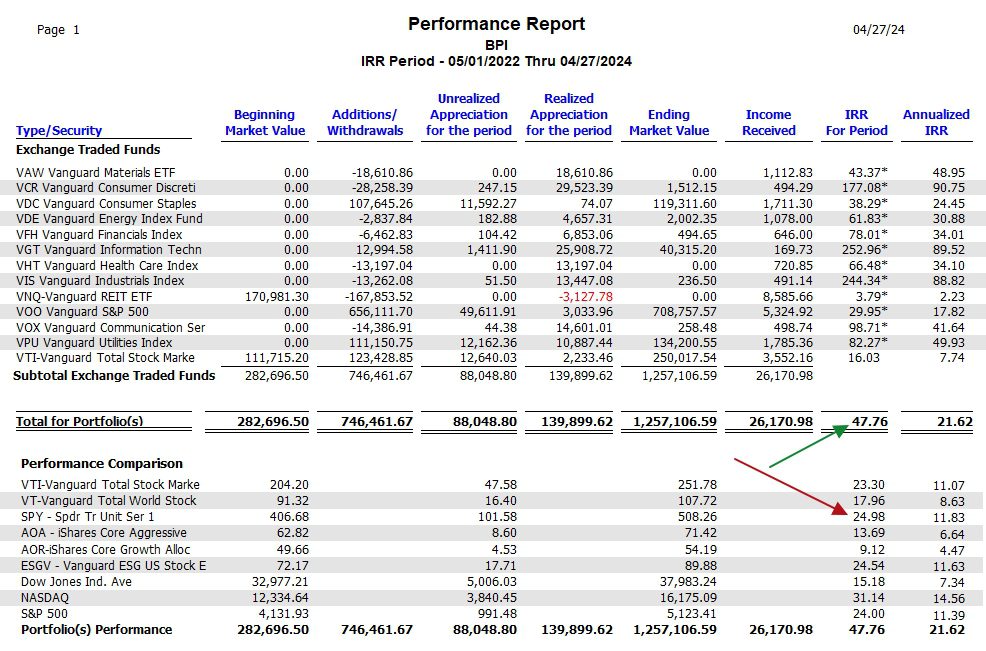
Nearly two years ago I launched the first (Carson) of several Sector BPI portfolios. Eleven ITA portfolios are currently using this investing model. Not all are publicly reported here on the ITA blog. How are these eleven portfolios performing using this particular investing model? The following data table shows how the different sectors performed over this two-year period. Keep in mind that not all eleven portfolios were using this investing model over the entire two-year period. Nor does the performance account for cash held in the various portfolios.
The four portfolios not using this model are: Copernicus, Schrodinger, Huygens, and Pauling.
Sector BPI Portfolio Report
In the following data table I list the eleven sectors ETFs and two U.S. Equities holdings, VTI and VOO. These 13 ETFs are used to populate the Sector BPI portfolios. Readers will recall the Sector BPI model calls for investing in VTI and VOO when cash is available and no sectors are recommended for purchase. Early on I referred or called these portfolios Sector BPI Plus accounts. I dropped the Plus so the title is less cumbersome.
While not many oversold and overbought cycles occurred over the past two years, we have seen sufficient sector rotations to build some history as to the viability of this model.
For the two-year period the Sector ETFs plus VTI and VOO gained 47.8% compared to a 25% gain for the SPY benchmark. Nine potential benchmarks are listed for further information.
If you look at the Beginning Market Value, eleven portfolios held shares in VNQ and VTI. Early in May of 2022 the first shares of other oversold sector ETFs were purchased.
The following data comes from the Investment Account Manager software, a commercial portfolio tracking program.
Discover more from ITA Wealth Management
Subscribe to get the latest posts sent to your email.
Lowell. What is your chief take away from this data. Thank you John.
John,
The Sector BPI hypothesis is working – even better than anticipated. The strategy of purchasing sector ETFs when the BPI Point and Figure data drops to 30% bullish or below and then using a 3% TSLO when the BPI data moves to 70% or higher is superior to holding on to any of the other potential benchmarks.
When sectors are out of favor or “resting” in the neutral zone and cash is available, supplement the portfolio by purchasing shares of VTI and/or VOO.
It will be interesting to see how this investing model works through an election period.
Lowell
John,
Your question raised a few questions for me. How well is the model performing over different time periods? The Investment Account Manager keeps data from month to month. I’m considering posting a blog that will examine how well all eleven (11) Sector BPI portfolios perform when one examines the data from quarter to quarter or over six month periods.
Instead of measuring performance (IRR values) from the start to the current data, check the performance over several different quarters, thus varying the time periods.
Lowell
This comment from John Shelton was filtered into Spam by mistake so I am re-posting it here.
Hi Lowell. I’ve read most of his stuff and I consider him one of my favorite authors. I particularly like his three pillars to invest the psychological part is prominent. My understanding is that most of his stuff and I consider him one of my favorite authors. I particularly like his three pillars to invest the psychological part is prominent. My understanding is that he lives in Portland and so I’m surprised that you haven’t connected with him in some fashion. l
He must be a marvelous intellect since he is a neurologist, a gifted writer, and gives great investing advice. Thank U. John