
Castle in England
The Carson portfolio does not need an update. However, to continue to build a base for this new investment approach, I’m committed to keeping investors aware of what is going on with the Sector BPI Model portfolio. No changes are anticipated as the Carson is currently holding the required shares of Energy and Technology. A limit order is in place to pick up more shares of VNQ. These are the three sectors positioned in the over-bought zone.
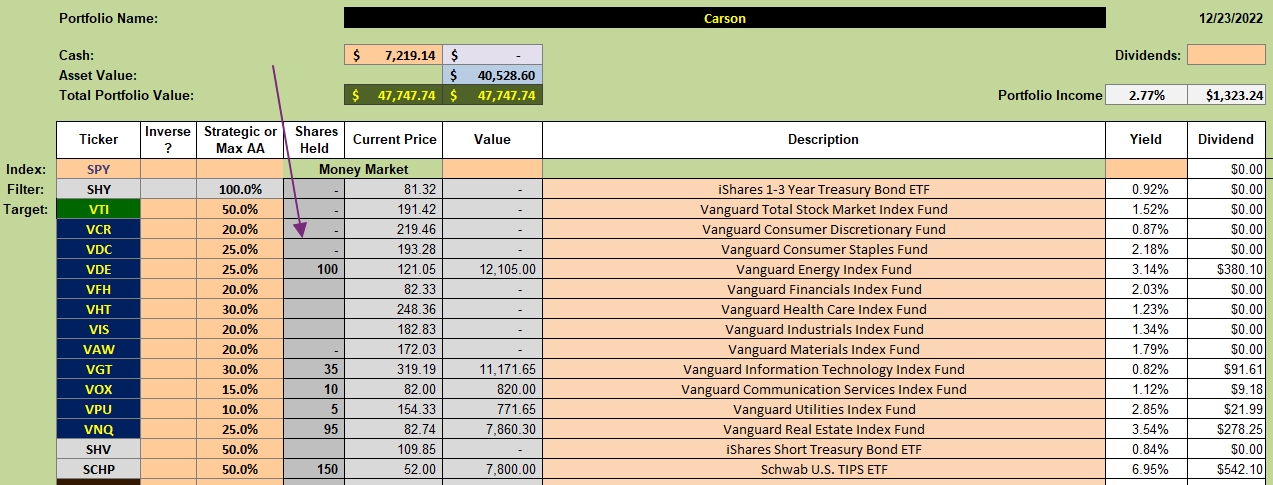
Carson Investment Quiver
The purple arrow points to the current holdings in the Carson portfolio. There are no new Buy recommendations at this point. This weekend I’ll take a fresh look at the BPI data.
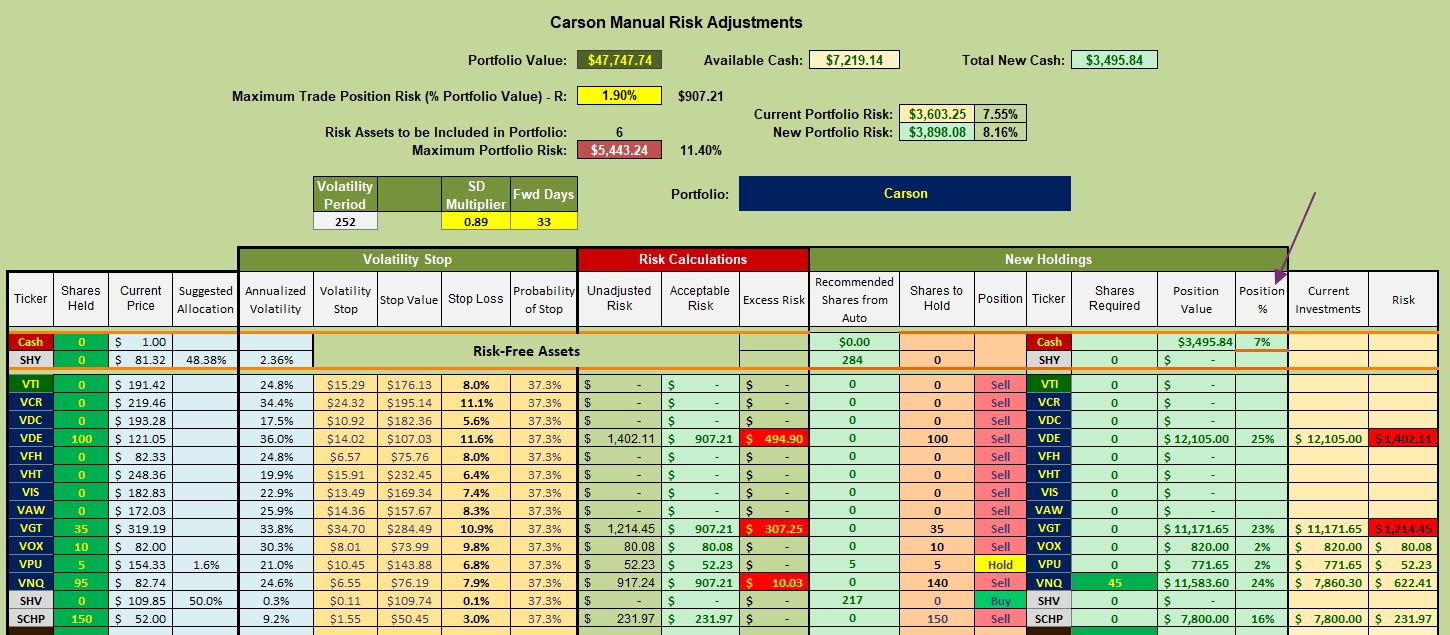
Carson Percentage Recommendations
The purple arrow points to the percentage each of the ETFs contribute to the Carson. I need 45 more shares of VNQ to bring the percentage up to the recommended 25% level. Since I tend to buy in groups of 5 shares, 45 shares of VNQ comes close to the 25% level.
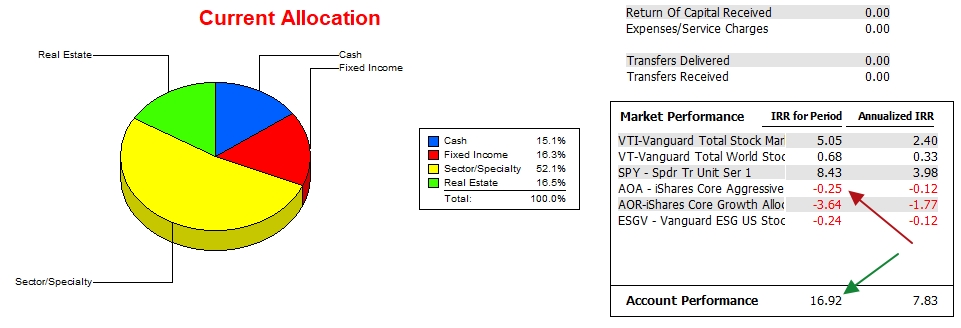
Carson Performance Data
Since 11/30/2020 the Carson has outperformed all the benchmarks I track using the Investment Account Manager (IAM) software.
Carson Portfolio: Creating A New Investing Model
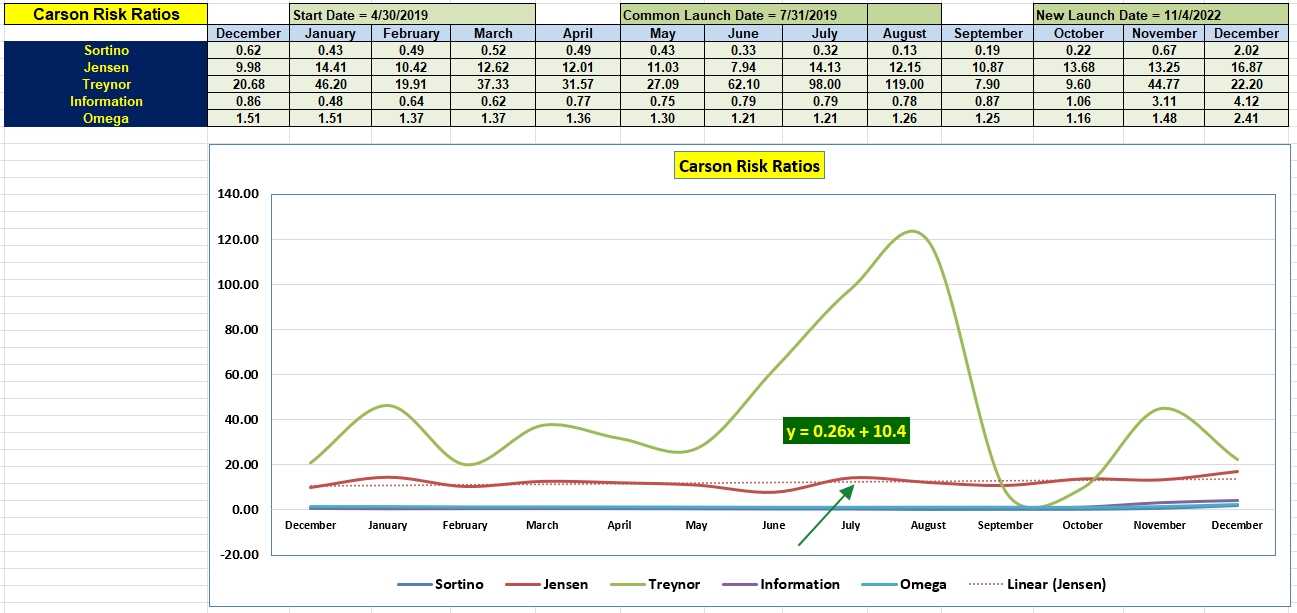
Carson Risk Ratios
Over the past year the Jensen Performance Index has been very strong. The goal is to maintain a positive slope for the Jensen. This will not be easy as the current 16 is extremely high.
Discover more from ITA Wealth Management
Subscribe to get the latest posts sent to your email.
45 shares of VNQ were purchased this morning so Real Estate is fully populated.
Lowell
Hi Lowell,
I am interested building a portfolio based on this new approach. I think it’s novel and promising. Can you tell me how I can get the latest version of the Kipling Spreadsheet? Also, I understand that it doesn’t work on the iOS operating system but may work using a simulated method of some sort. Can you also let me know how that might work?
Thank you,
Bill
Bill,
As a Lifetime member, you have access to the Kipling SS. Here is the link and I will send the password via e-mail.
https://itawealth.com/modified-kipling-workbook-with-risk-ratios/
If you have Parallels, the spreadsheet may work on the Mac. No guarantee.
Another option is to follow the BPI data that will be published regularly here at ITA and take your Buy and Sell (TSLO recommendations) based on that information.
Lowell
Updating the BPI sectors this evening, only Technology (VGT) is over-sold. None of the sectors are over-bought so readers who are following the Carson would do nothing.
Lowell
Hello Lowell,
I would be grateful to have access to the latest Kipling SS as well. Thanks. -Martin
Martin,
You will find the instructions in your e-mail box. Let me know if you need more help.
Yahoo download is not working so make sure you have a Tiingo account as the downloading of prices from that source works. Tiingo (two ii’s) is free.
Lowell
Thank you, Lowell. I am up and running with the latest Kipling using Tiingo Adj prices. Just noticed that H-A Charts do not display any data. I am running Windows 11 / Excel on an iMac under Parallels — perhaps it is a Parallels-related issue…?
Martin,
I too use Tiingo Adjusted Prices.
Interesting that only H-A is not displaying any data. I assume BHS, LRPC, and DM all display data? If this is the case, then it is Parallels that is interfering. H-A, in my opinion, is the least useful model.
Lowell
All,
I don’t think this is an Ios or Parallels problem. I am on Excel, Windows 11 and having the same problem. HAs for the Tranche sheet are still being calculated using Tiingo prices, it’s just the HA charts sheet that is not working.
I noticed that Microsoft did an update to Office on December 13, 2022. That’s about when I started not being able to download prices using the Yahoo option and when the HA charts were no longer being displayed. This is only a guess, but I’m assuming that the current problem associated with the Yahoo downloads and HA charts is associated with the Office update.
~jim