
Kew Gardens, London, England
This week I will go through the first full review of the Rutherford-Darwin Portfolio since the introduction of my new Management Plan ~ two weeks ago. This period has been devoted to setting up the portfolio to the point where I can review all the strategies to be employed in the construction and management of this portfolio.
As in past reviews, I will start with a review of price action in the US equity markets since this is arguably the most familiar and represents the asset class in which most readers of this blog will be interested/focused.
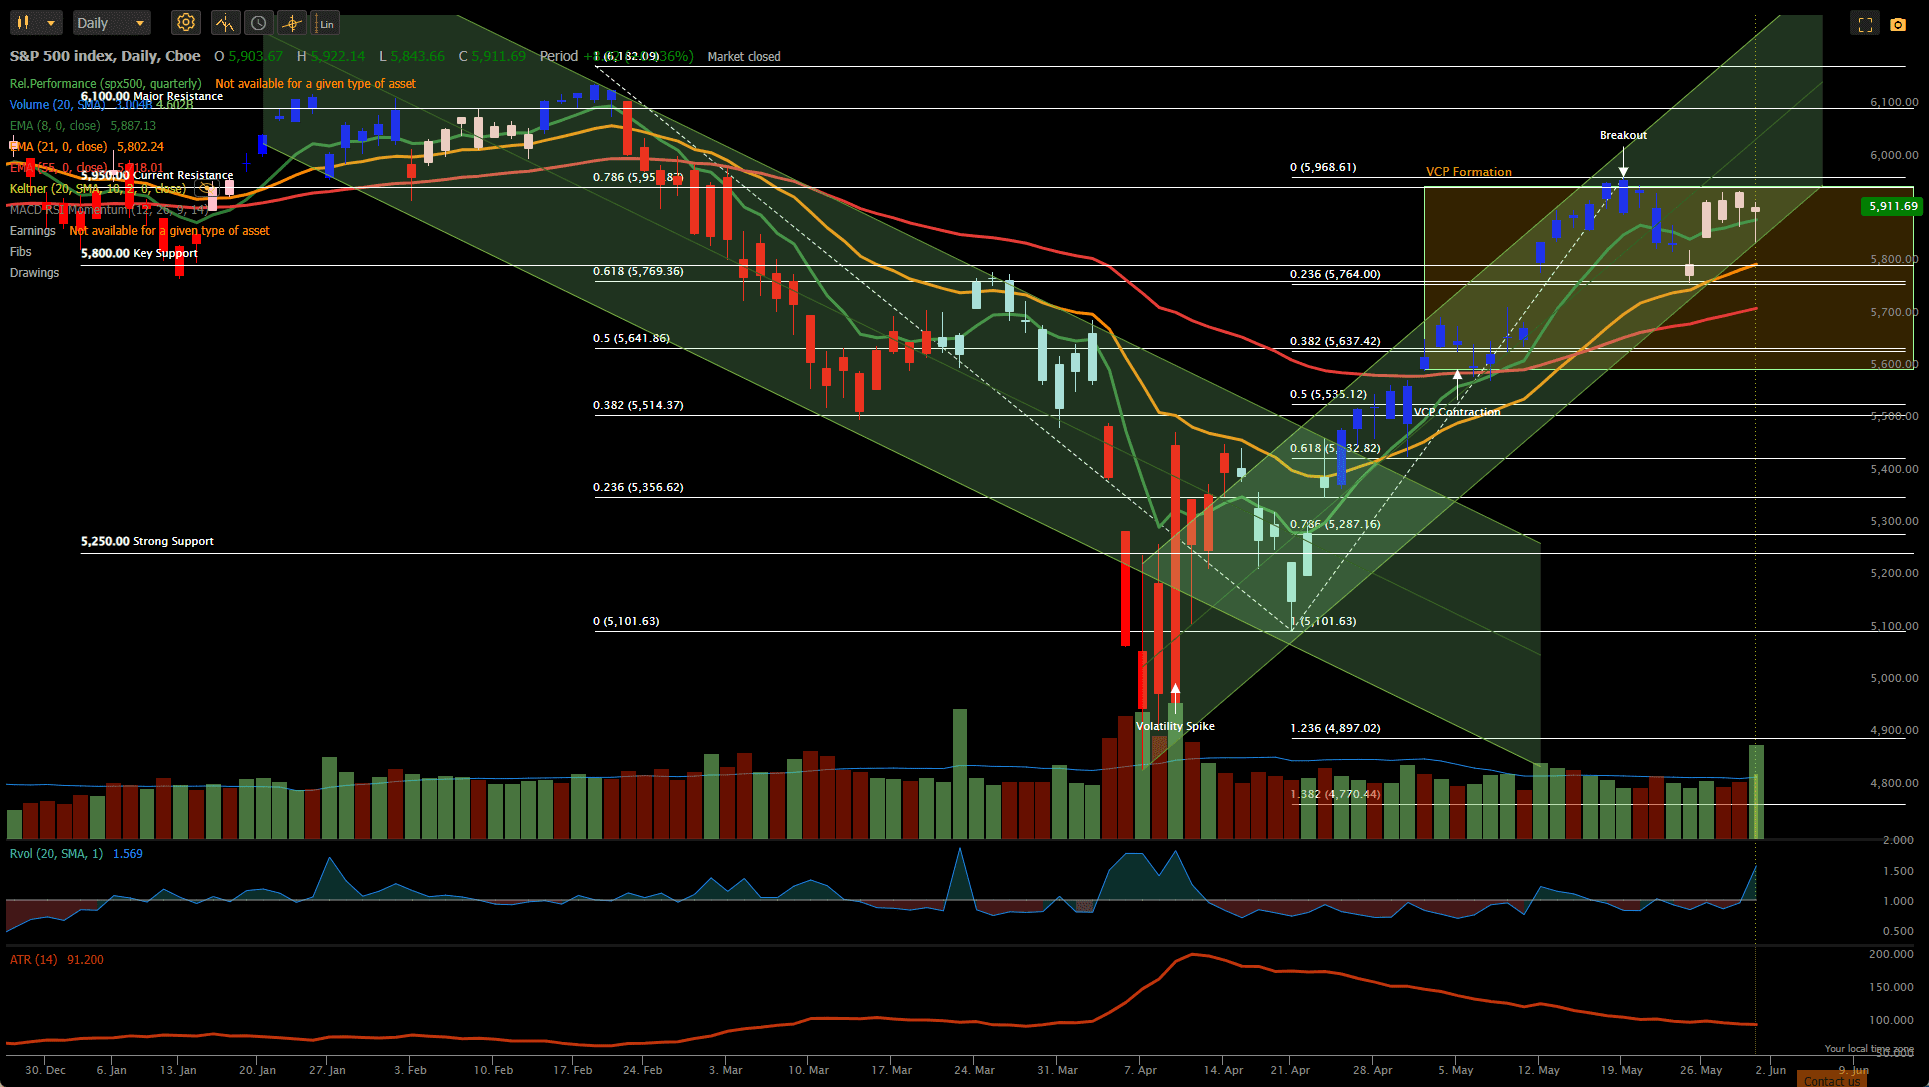 It was a holiday-shortened week in the US equity markets with the SPX (S&P 500 Index) trading in a sideways consolidation pattern but closing the week ~1.8% higher than last week’s Close. Price remains in the uptrend channel that started in April following a sharp sell-off and period of high volatility. Since then, volatility has dropped to more normal levels setting up a Volatility Contraction Pattern (VCP) that often precedes a breakout. There was a weak attempt to break through resistance at ~5950 on 19 May but there was little conviction with only average volume. We are still testing this important resistance level but need to see more volume. Volume was high on Friday, but price found it difficult to penetrate the 5900 level below this major resistance. Should we break through the 5950 level the next major resistance is likely to come in the 6000-6100 range (6000 psychological “round number” and 6100 previous all-time highs). The first potential support level below current price is ~5800.
In terms of performance relative to other major asset classes:
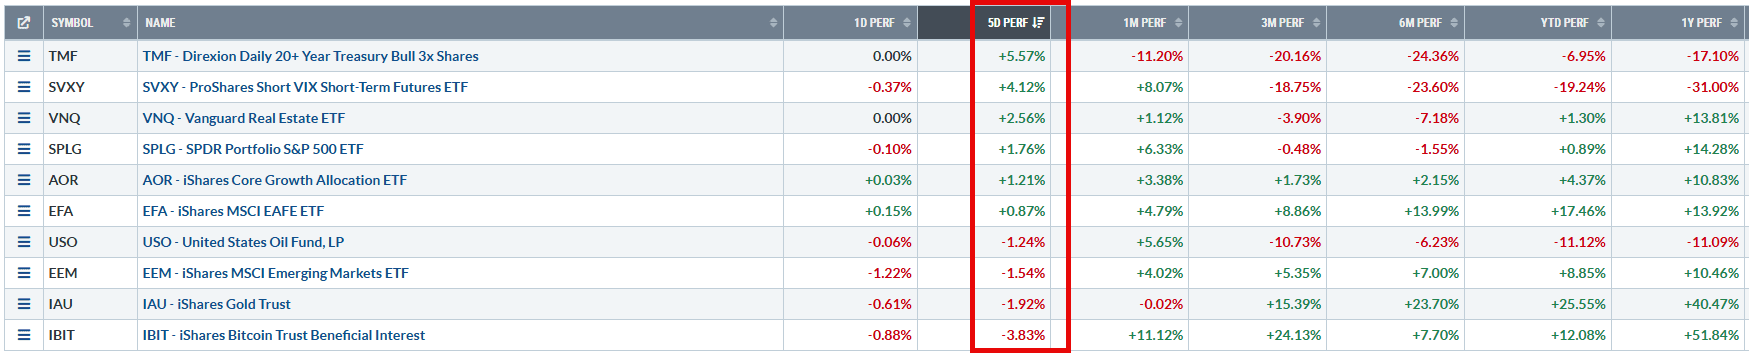 US equities came out in the middle of the pack with bonds leading the way and cryptocurrencies faring the worst.
Core Darwin Portfolio
The Core Darwin portion of the portfolio comprises ETFs chosen from the 9-asset “quiver” and showing positive momentum in an uptrend. At the present time, five ETFs are held in the portfolio:
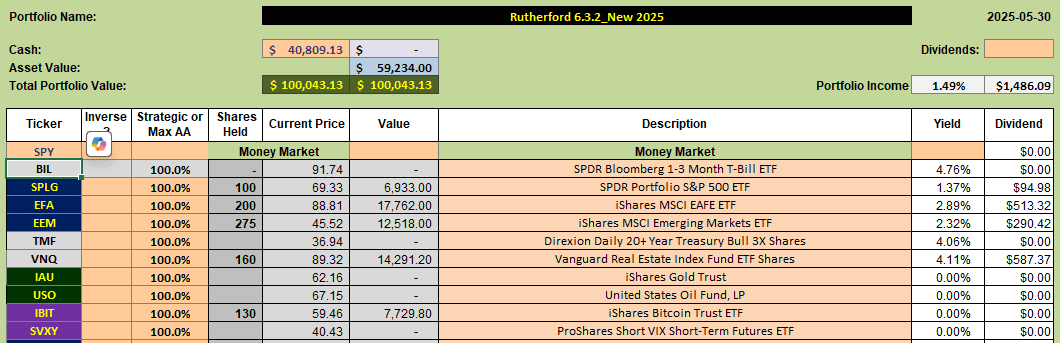 We see that these five ETFs are presently treading water with a small profit of ~$40. IBIT (crypto) was added to the portfolio on 16 May when it triggered a Buy suggestion in the Kipling worksheet with confirmatory indicators supporting the recommendation:
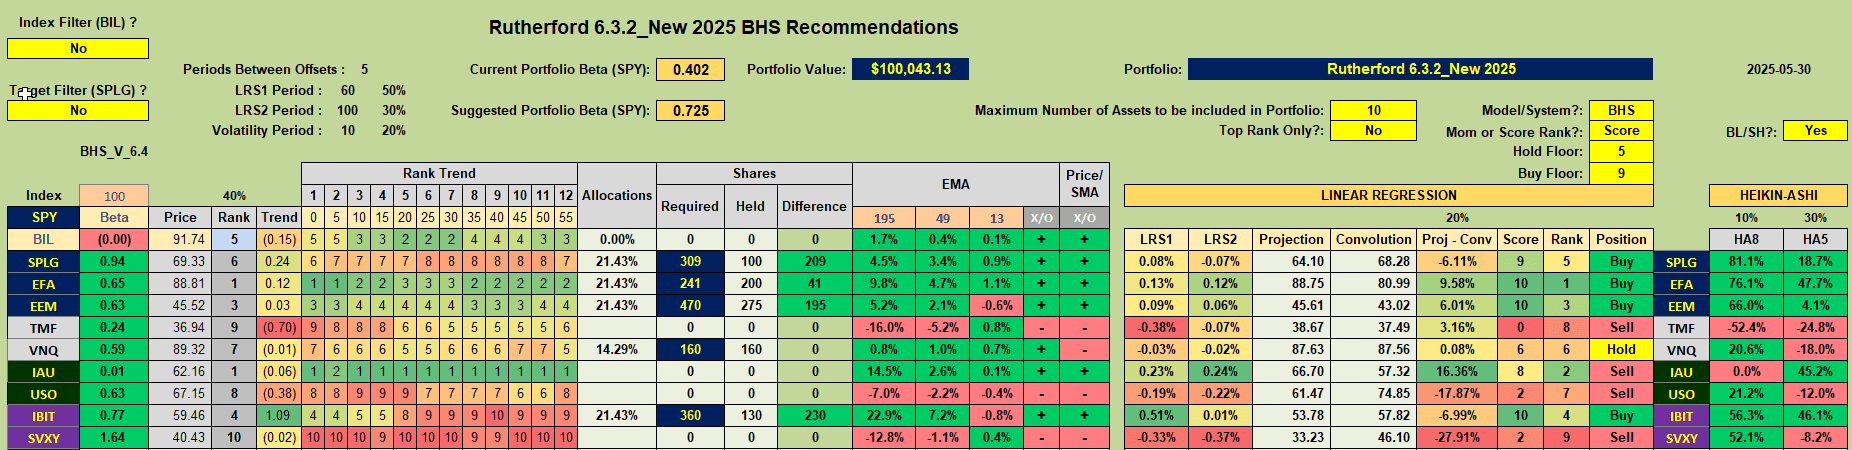 As we can see from the above screenshot, SPLG, EFA, EEM and IBIT are still showing as recommended Buys with VNQ a Hold.
I have decided to switch my Commodity Metals ETF from SLV (Silver) to IAU (Gold). This probably isn’t a particularly significant switch other than Gold tends to be less correlated to the other assets than Silver (that includes an “industrial” component to the usage) and so provides a little more diversity. Shares of IAU are also less expensive than shares of GLD (the other major ETF tracking Gold bullion) so I may likely be able to buy more than 100 shares that would allow me to sell Call Options against them to hedge/generate income.
IAU is currently fluctuating between Buy and Sell recommendations in the Kipling worksheet so I am watching the confirmatory indicators:
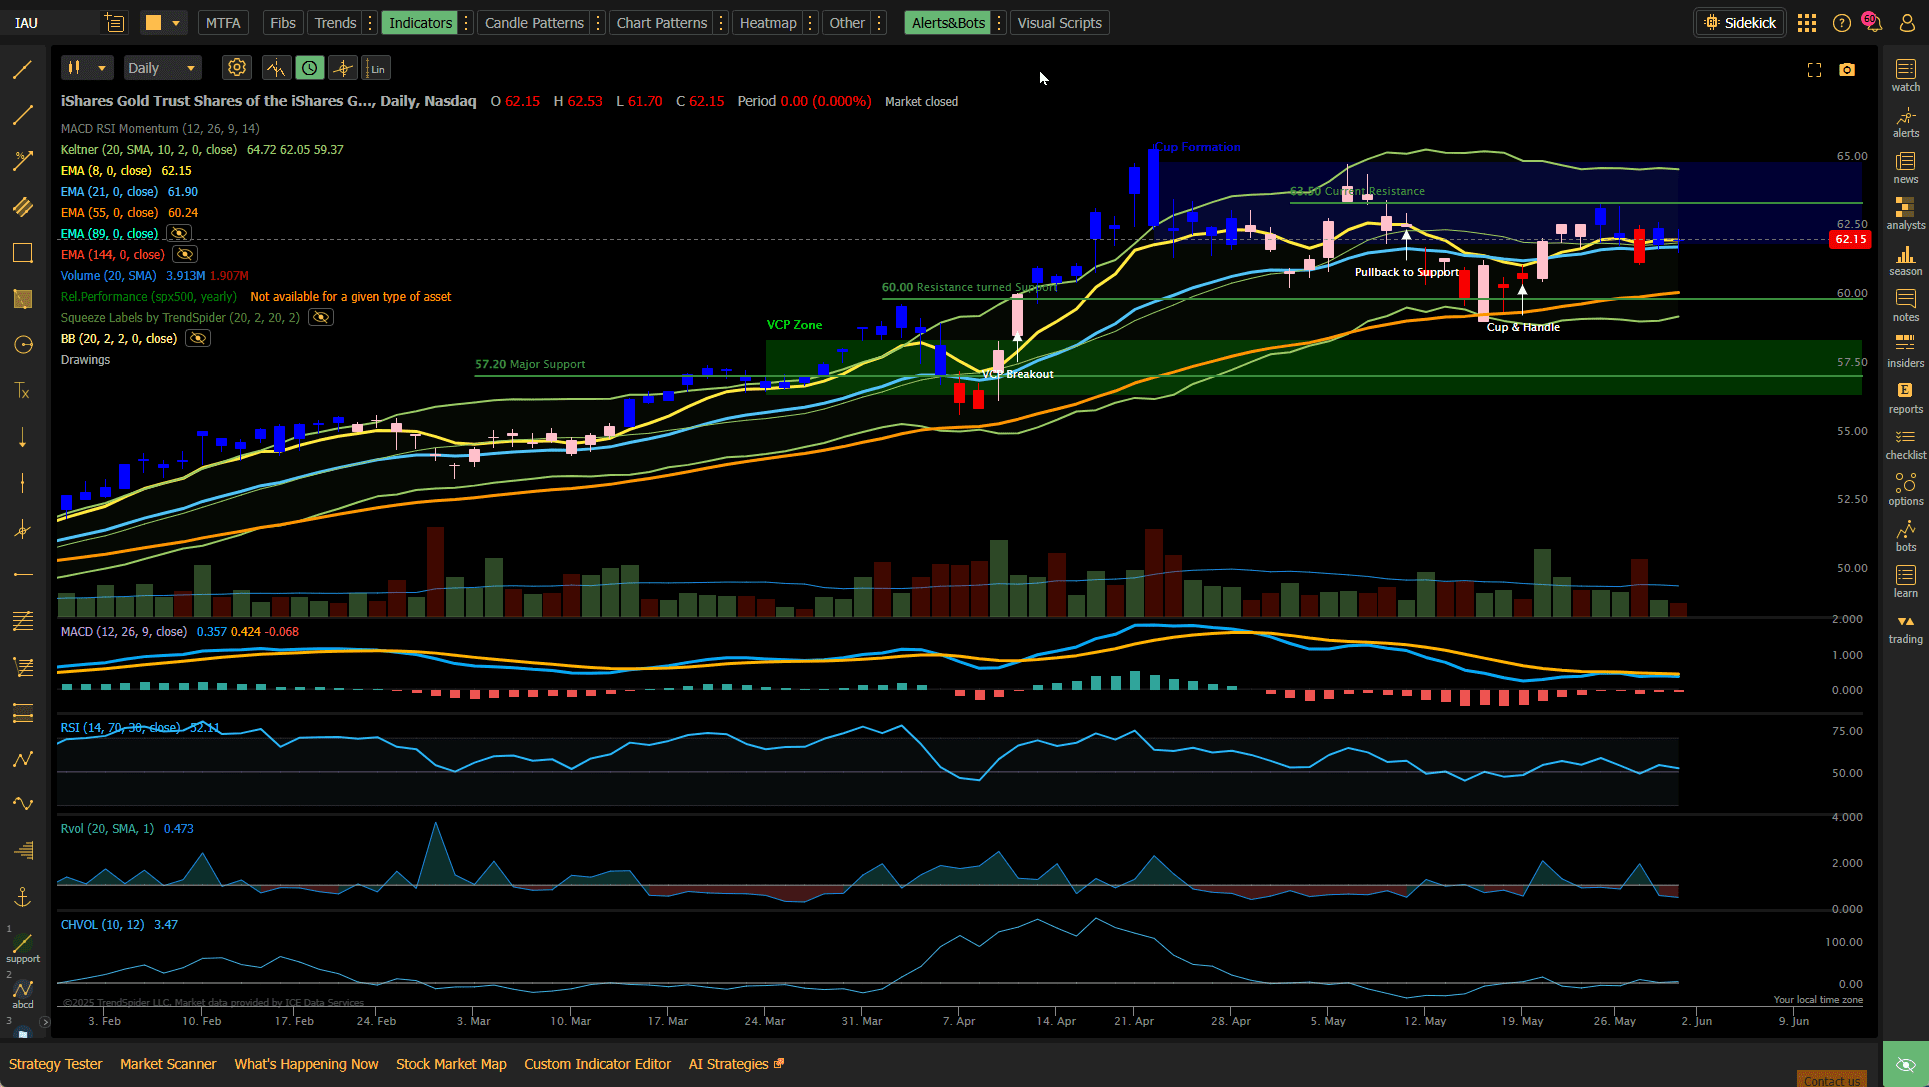 Should IAU break out of its current consolidation range, especially if on high volume, then I will be adding this ETF to the portfolio.
Checking Allocations
Since the management Plan identifies conditions for making possible adjustments to the allocation of funds to each asset held in the portfolio let’s look at the current situation:
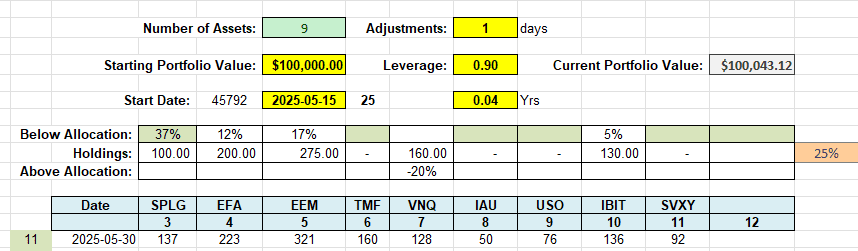 Where we see that SPLG is currently under allocated with the portfolio holding 100 shares and the recommended number of shares (based on risk parity and +/- 25% variance) suggesting 137 shares (bottom row of table).
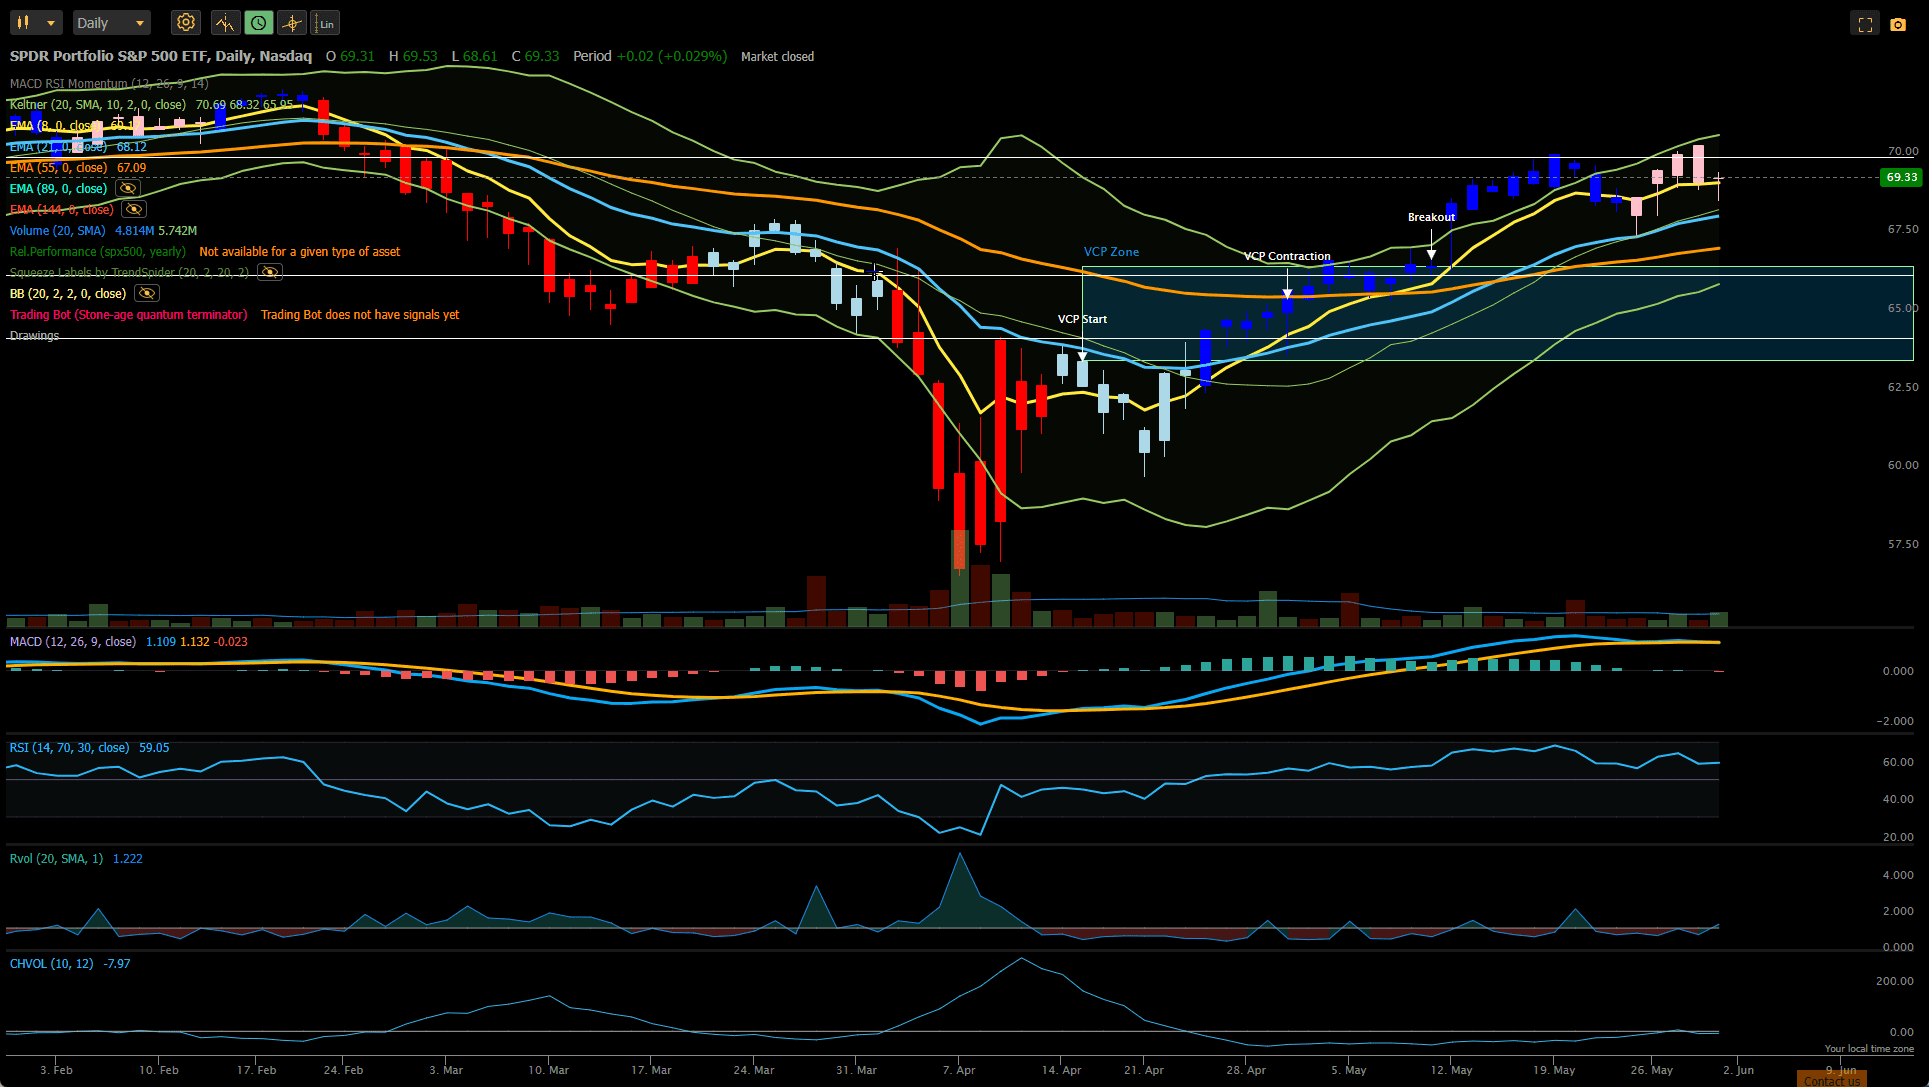 Is it worth an adjustment at this point? SPLG is in a sideways consolidation pattern and the MACD has just signaled a potential change in trend. However, the overall picture is cautiously bullish so I will be watching this ETF for a possible break out to the upside, preferably on high volume, at which time I will add to the current position, maybe 50 shares.
Allocations to the other ETFs presently held in the portfolio are all within 25% of the calculated numbers for risk parity so I will not add/reduce holdings there.
Rutherford Risk Management
Income and Hedging
The third step in the review is to look at the opportunities for generating income and/or hedging.
At the present time I have sold Calls against all the ETFs held in the portfolio. The reason for doing this was because I saw evidence of consolidation with the strong uptrend losing momentum. In the indicator charts, candles were changing from blue (bullish signals from MACD and RSI) to white (mixed signals). This can be seen in the following chart for EEM (Emerging Market Equities):
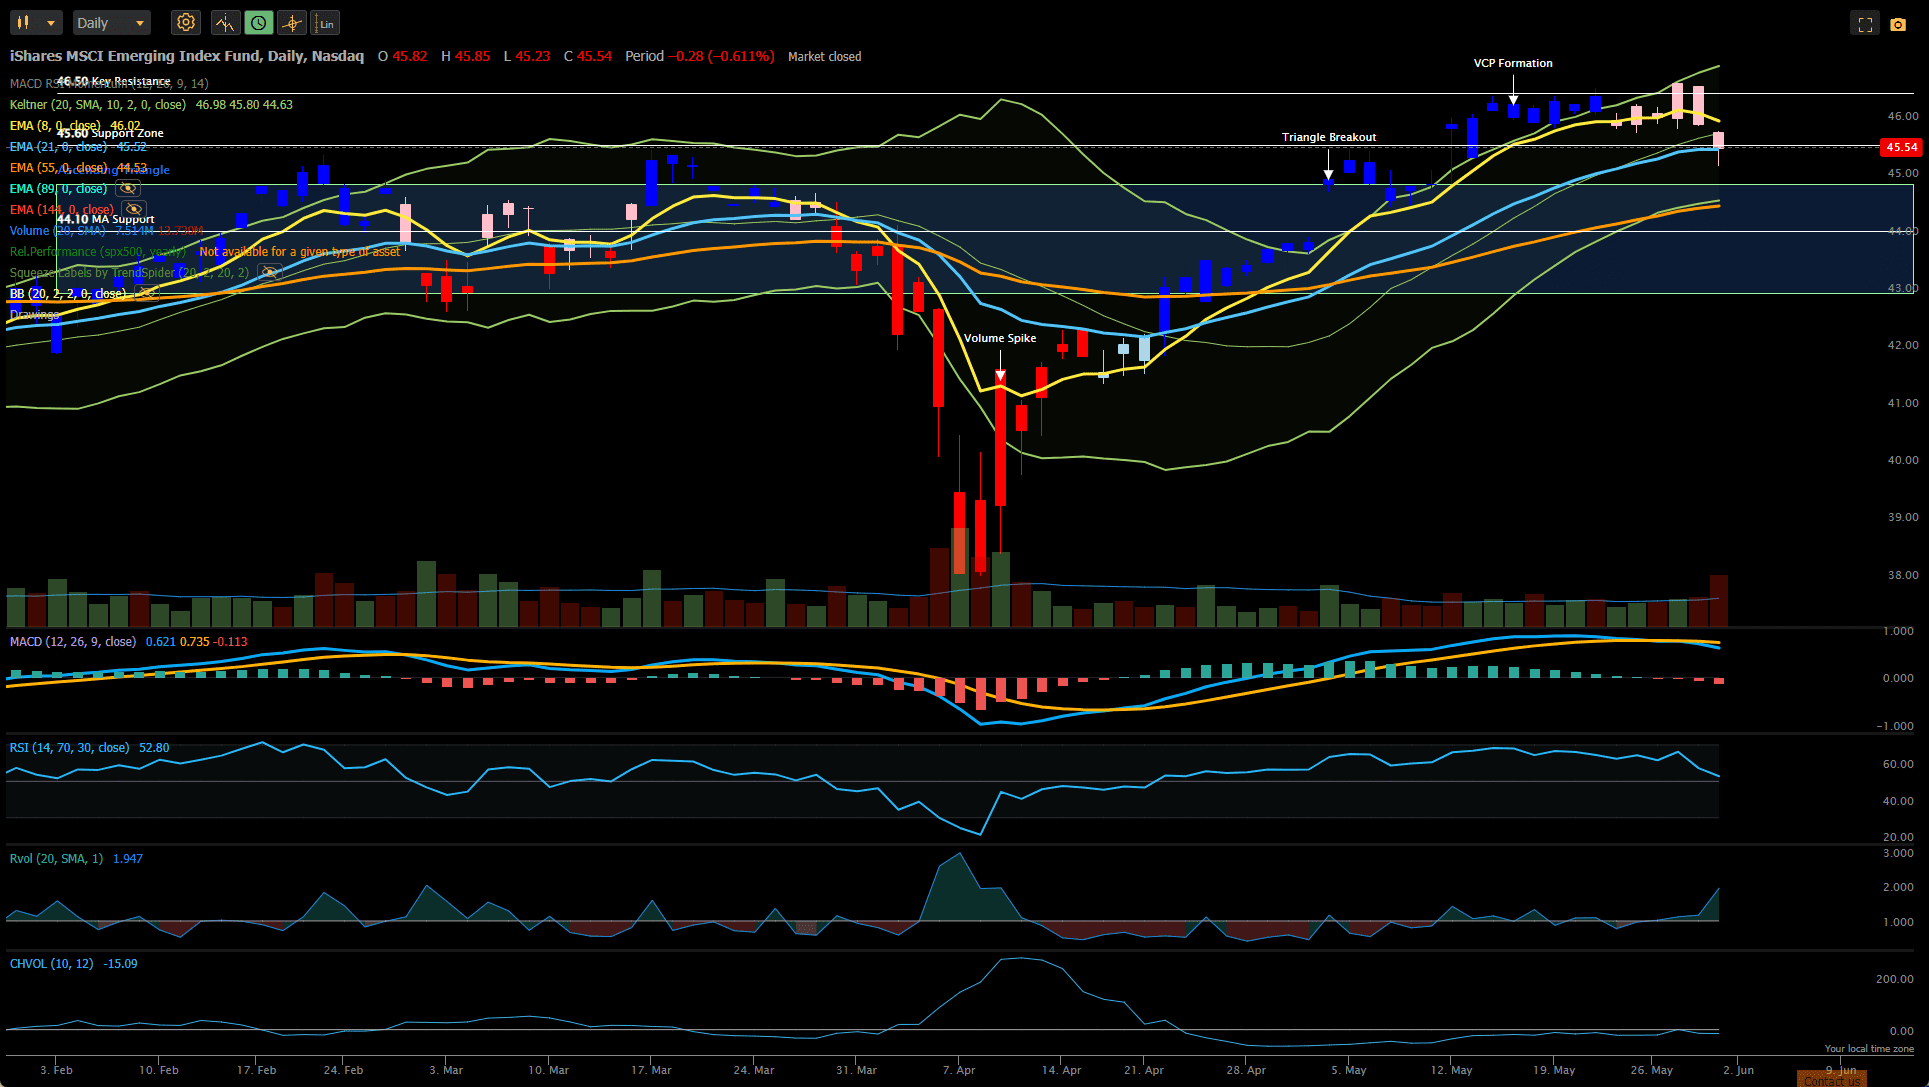 I therefore chose to sell Call Options just above current prices at levels of potential resistance. In this example, since I am holding 200 shares of EEM I sold 2 x $46 Strike Call Options, expiring 20 Jun. I sold these at 0.75, receiving a credit of $150 (2 x 100 x 0.75).
I made similar trades in SPLG, EFA, VNQ and IBIT, bringing in a total credit of $498:
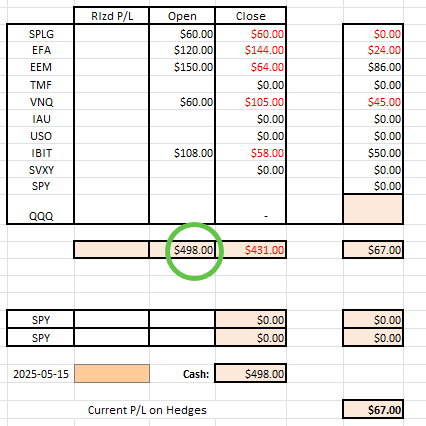
The $498 “income” can also be viewed as a weak hedge against a moderate drop in market prices. The “income” is also not yet fully realized (only $67 is “earned” to date) since time is necessary to allow the premium to decay – but, providing that each ETF stays at prices below the strike price of the Call Options sold, this will become realized income at expiry on 20 June. This full income will be earned if prices fall, stay the same, or even rise slightly (up to the strike price) between now and 20 June.
Portfolio Hedging
As noted above, this $498 credit can be held as “income” and/or used to purchase additional portfolio insurance.
Let’s look at how we might “insure” the portfolio, as a whole, rather than manage each ETF separately. First, I’ll check the correlation between the holdings in the portfolio and ETFs that track the major indices:
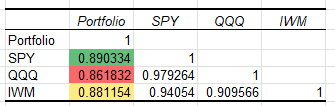 The portfolio correlates well (0.86 – 0.89) with all these major Indices (S&P 500, Nasdaq 100 and Russell 2000) so we could use any of these ETFs. Since SPY ranks highest, and liquidity is excellent, I will use this ETF.
I then need to calculate my Beta exposure to SPY:
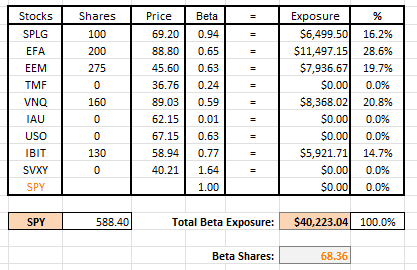 Multiplying my dollar allocation in each ETF by the Beta of the ETF relative to SPY (as shown in the second column – green background – of the Kipling worksheet above) I note that the 5 ETFs currently held in the portfolio is (roughly) equivalent to holding ~$40,000 of shares in SPY – or 68 shares (with SPY trading at ~$588). This is the “Delta” that I need to hedge using Options.
If I use $252 of the $480 credit received when I sold the Call Options I can buy a 575/550 “Vertical” Put Spread, expiring 13 Jun that will give me ~$2,200 of protection should we have a ~7% correction in the next 2 weeks:
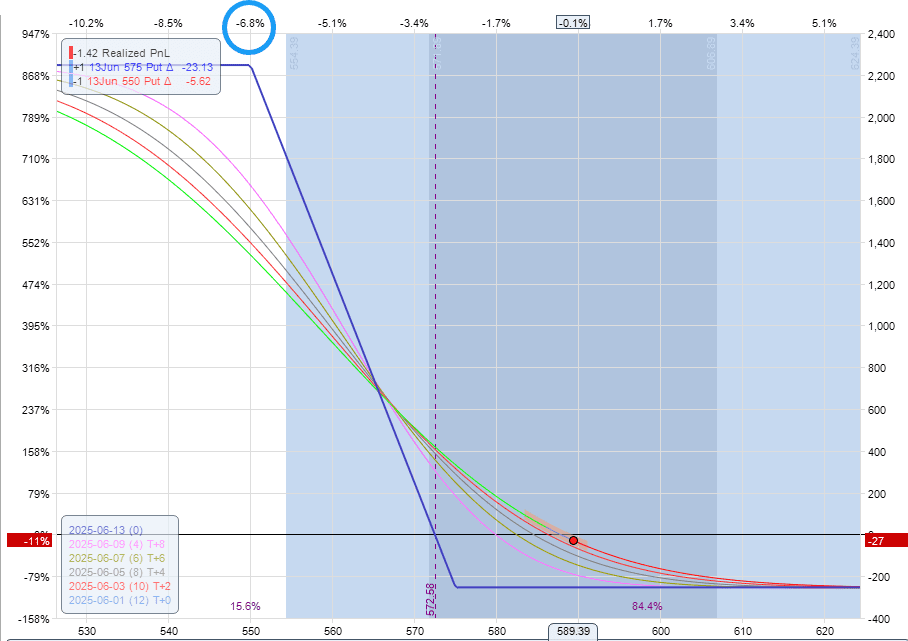 To illustrate, the impact of the hedge looks something like this (assuming that the holdings are represented by 68 shares of SPY):
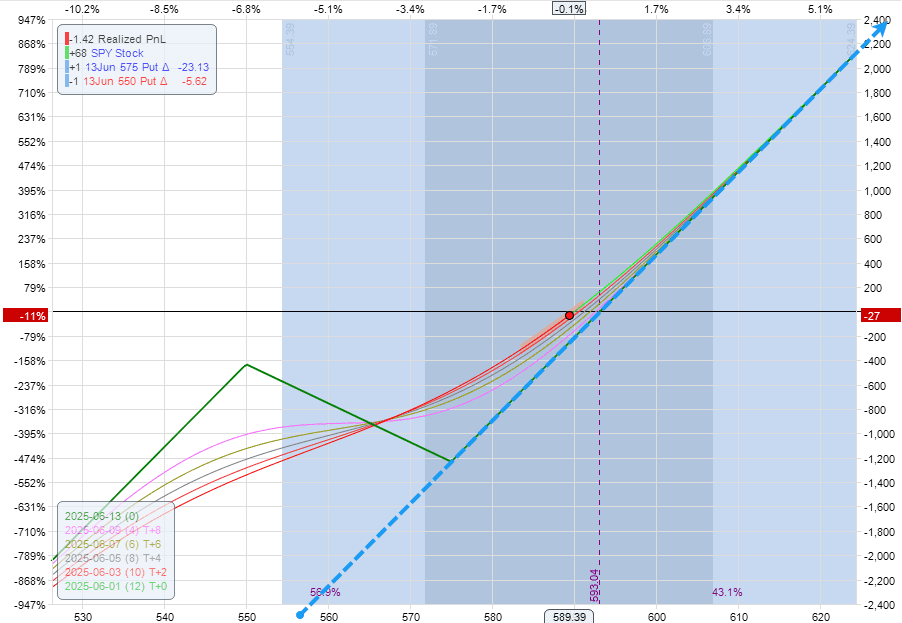 Where the blue dashed line represents the Profit/Loss of the portfolio without the hedge and the green line shows the Profit/Loss with the hedge. Maximum loss is likely to be less than $1,000 (1% total portfolio value). I still have $482-252 = $232 credit from the sale of the Call Options with which to buy more insurance should that be necessary. If there are significant price changes over the next 2 weeks I will also be monitoring positions to make necessary adjustments to the current holdings if called for.
Summary
The current Core Darwin portfolio is populated with 5 ETFs that are presently in bullish trends and showing positive momentum. This portfolio is hedged through the Sale of Call Options against current holdings with a portion of the credits received from these sales being used to finance the purchase of downside insurance in the form of a Vertical Put spread in an index ETF with high correlation to the holdings in the portfolio.
I am monitoring the Portfolio for opportunities to add new holdings (IAU) and/or more shares to existing positions should we see a breakout to the upside or, maybe, exit existing positions (VNQ) on signs of weakness and a change in trend/momentum.
Check back on this post tomorrow and I will add another illustration quantifying the level of protection/hedges in place. Unfortunately, I cannot do this at the time of writing because markets are closed and I need real-time data to populate my spreadsheets.
Update: 2 June, 2025 11:00 am EST
As promised above, the following screenshot shows the degree of hedging achieved through the sale of the Call Options:
 Of the 68 SPY share equivalent of the 5 ETFs held in the Core Darwin Portfolio 66, or almost all modest movement, is hedged through the sale of the Call Options. In addition, time decay (Theta) from the sale of these Options adds $23 per day to the value of the portfolio.
However, these numbers are not static and change as the market moves – hence the decision to add a portfolio hedge to reduce the risk of a significant downside move. By adding the Vertical Put Spread in SPY we get the following picture:
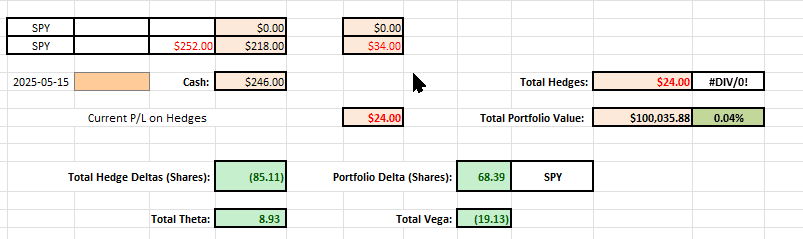 where I have bought “insurance” for $252 and increased protection (overhedged slightly) to the point where the equivalent of 85 shares are hedged. This also impacts the Theta (time decay) in that only ~$9 per day is generated through the passage of time. Checks and balances – the “art” of risk management.
Update: 2 June, 2025 15:30 EST
IAU has just pushed through resistance at ~$63.50 so I have purchased 50 shares for the Core Darwin Portfolio. In dollar terms the allocation is small since IAU is currently trading at a volatility of ~27% compared to it’s historical average volatility of ~14%. This means that I have reduced the allocation by about 50% to comply with my risk parity/risk management plan on the assumption that volatility increases as price drops (as is the case for equities). However, this may not be the case for commodities and volatility may increase as price rises – so I may need to re-tune my allocation algorithm a little to account for this. I will take a closer look at the historical relationship between price and volatility for commodities in the next few days but, since this is a close call on the entry, with only average volume rather than heavy volume, I’m satisfied just to have a toe in the water at this point.
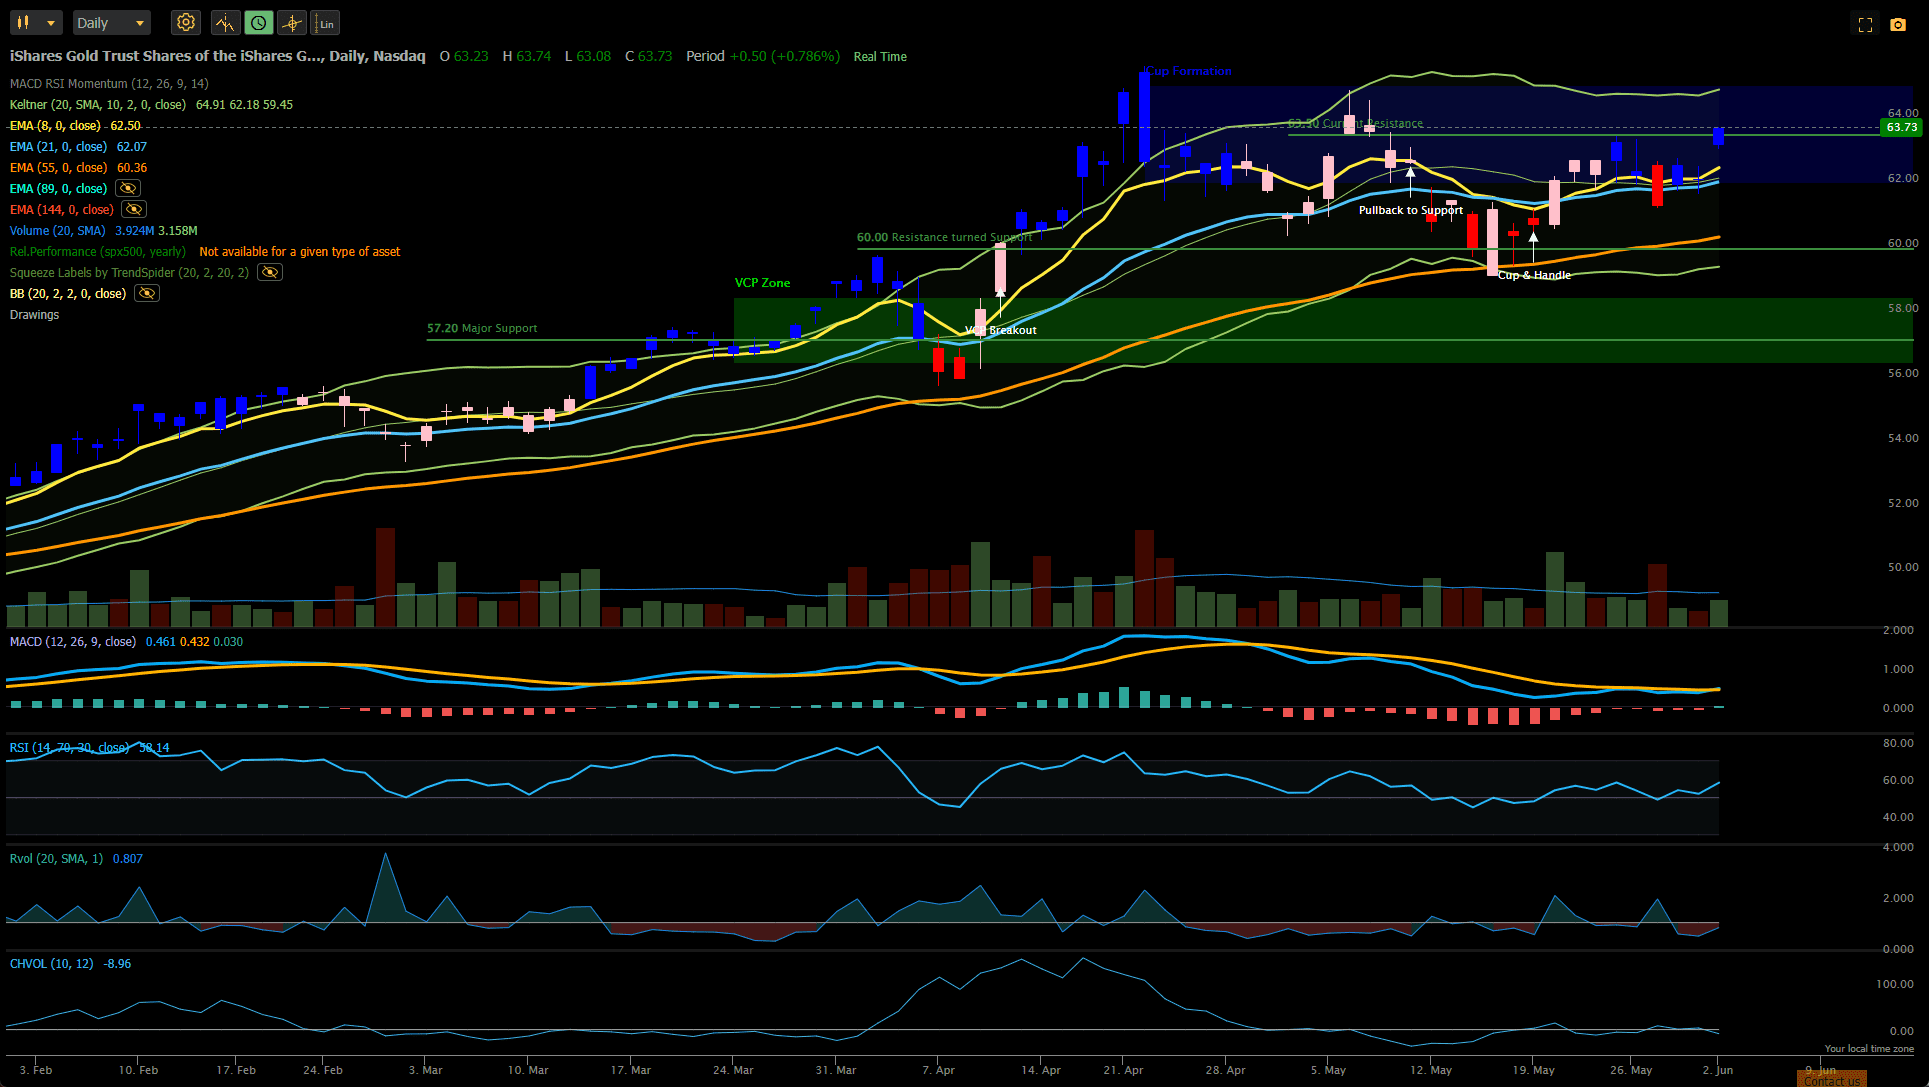 Because of the low correlation of IAU to the other assets, my Beta portfolio exposure barely changes – so I don’t have to worry about other adjustments at this point.
Discover more from ITA Wealth Management
Subscribe to get the latest posts sent to your email.
Note the update to this post.
IAU (Gold) is testing resistance at ~$63.5 and all signals are suggesting a Buy. However, volume is low and the move doesn’t seem to have a lot of conviction so I will continue to monitor until I see a more convincing breakout – but it’s close.
I have added 50 shares of IAU to the portfolio – see Update to the post above.