
Completely Forgotten Oregon as this house is no longer standing.
Today we return to the review of one of my two favorite portfolios. The other is the Schrodinger. Why do I look with favor upon the Copernicus? It is simple to manage and it is an excellent portfolio for those 10 or more years away from retirement. Young folks will find the Copernicus particularly to their liking and I strongly advocate saving in a Roth IRA. While we know the standard IRA and Roth IRA are no different if the tax laws remain the same, this is highly unlikely. Since the probability of taxes increasing in the future it makes sense for young folks to save and max out their contributions to a Roth IRA.
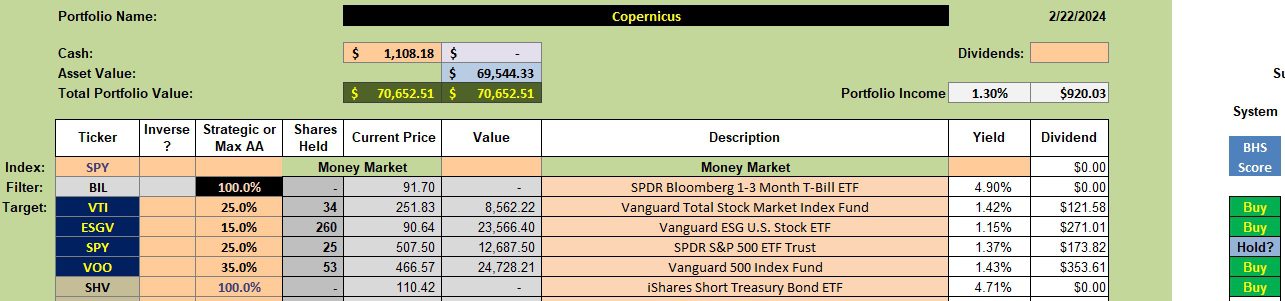
Copernicus Security Holdings
While I am using four equity ETFs with the Copernicus, it is possible to reduce this to VTI and VOO. I checked today and see where the expense ratios for VTI if one basis point. That is rock bottom. It does not get better than one basis point.
The goal with the Copernicus is to hold as little cash as possible and never sell. Try to add more new money when the market is down and purchase more equity shares at that time. Right now the market is very high so invest your basic minimum you can afford this month or early in March. Put money aside to invest when the market dips.
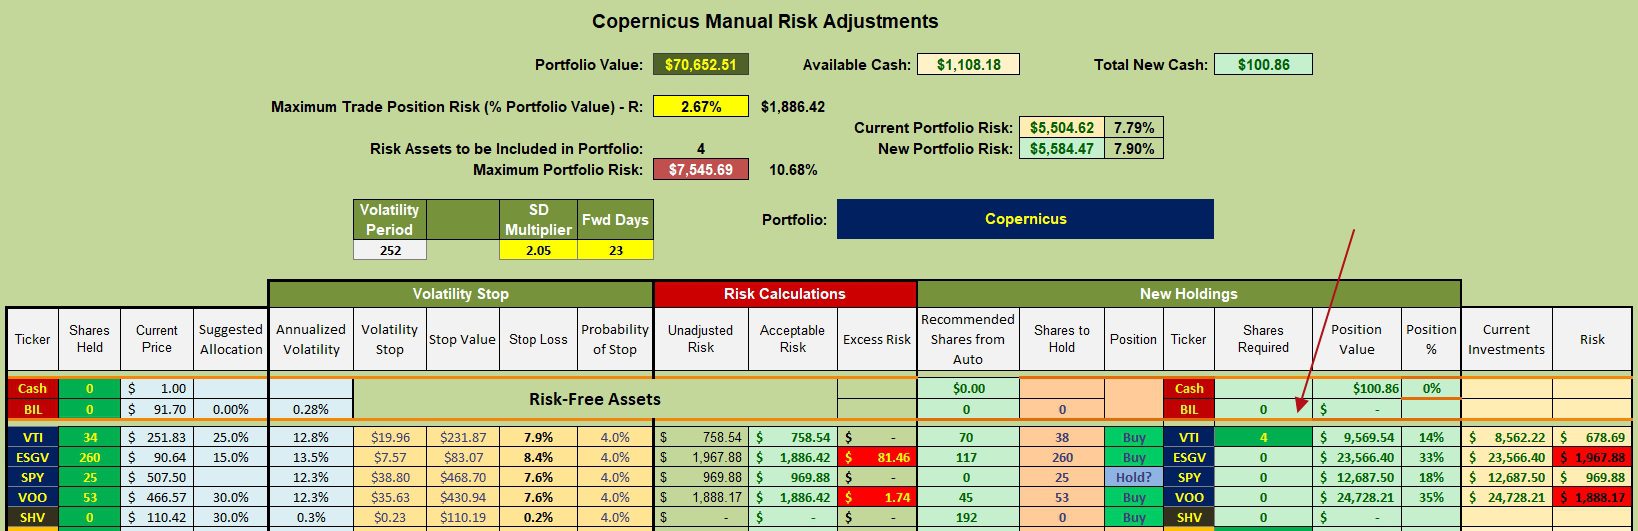
Copernicus Manual Risk Adjustments
I generally do not include this worksheet from the Kipling spreadsheet as we are investing only in U.S. Equities. If I were to follow the recommendations I would sell shares of ESGV to bring it down to 117 or 120 shares when rounding up. That money would be used to bring VTI up to 70 shares. Since there is overlap in the stocks found in VTI and ESGV we do nothing. I have limit orders set to pick up more shares of VTI if and when the market backs off from the current high.
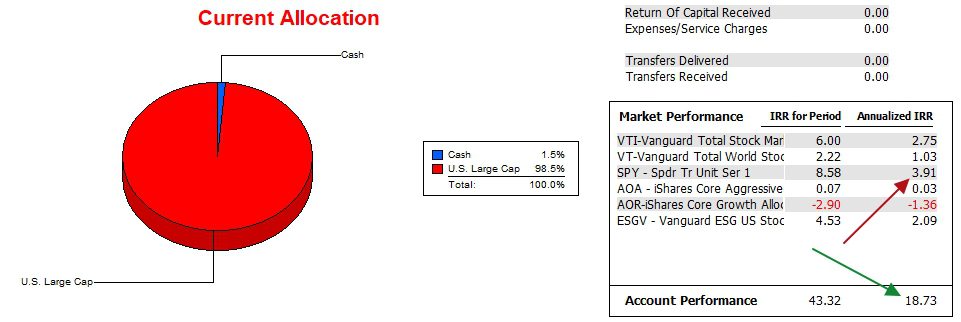
Copernicus Performance Data
How has the Copernicus performed compared to the S&P 500 (SPY) over the past 25.5 months? The following calculations come from the commercial software, Investment Account Manager. The Copernicus is smashing the benchmark over this time period. This is another reason to favor the Copernicus. The delta between the Copernicus and other potential benchmarks is even greater.
It is most difficult to outperform the S&P 500, but the Copernicus is doing so. The logic is tied to the benefits from dollar cost averaging. Many shares were purchased in 2022 when the market dropped.
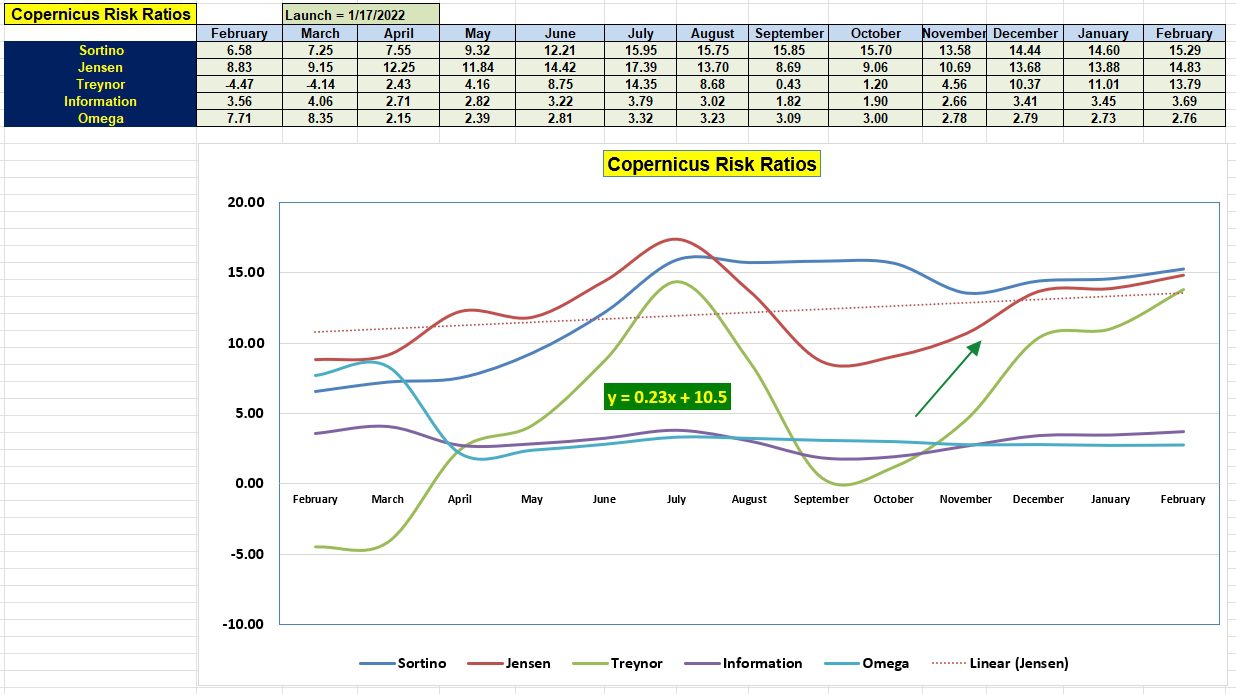
Copernicus Risk Ratios
Since the Copernicus is essentially a 100% stock portfolio, is it a high risk account? In one sense it is high risk, but the Jensen Performance Index (JPI) says otherwise as anything above zero is excellent. The Jensen Alpha, another name for JPI, is 14.8 or a very high number.
While the Information Ratio is not the highest it has been over the past year, it too is very strong. Another positive sign is the positive slope (0.23) for the Jensen. When you see the y = equation you are reminded of your Algebra I class. At least I hope this brings back memories.
If readers are uncomfortable with an all equity portfolio I have a suggestion. To protect capital, place an 8.0% Trailing Stop Loss Order (TSLO) under each security. This will limit losses to 8.0% and if the portfolio climbs high the possible loss is reduced. If an 8.0% loss is too much lower the TSLO percentage.
Questions and Comments are always welcome. Place them in the Comment section provided with each blog post.
Discover more from ITA Wealth Management
Subscribe to get the latest posts sent to your email.
You must be logged in to post a comment.