
See no Evil, Hear no Evil, Speak no Evil – Koh Samui, Thailand
US Equities were weak over the shortened 4-day trading week with prices still consolidating in the 6800-7000 range/resistance zone of the SPX (S&P 500 Index):
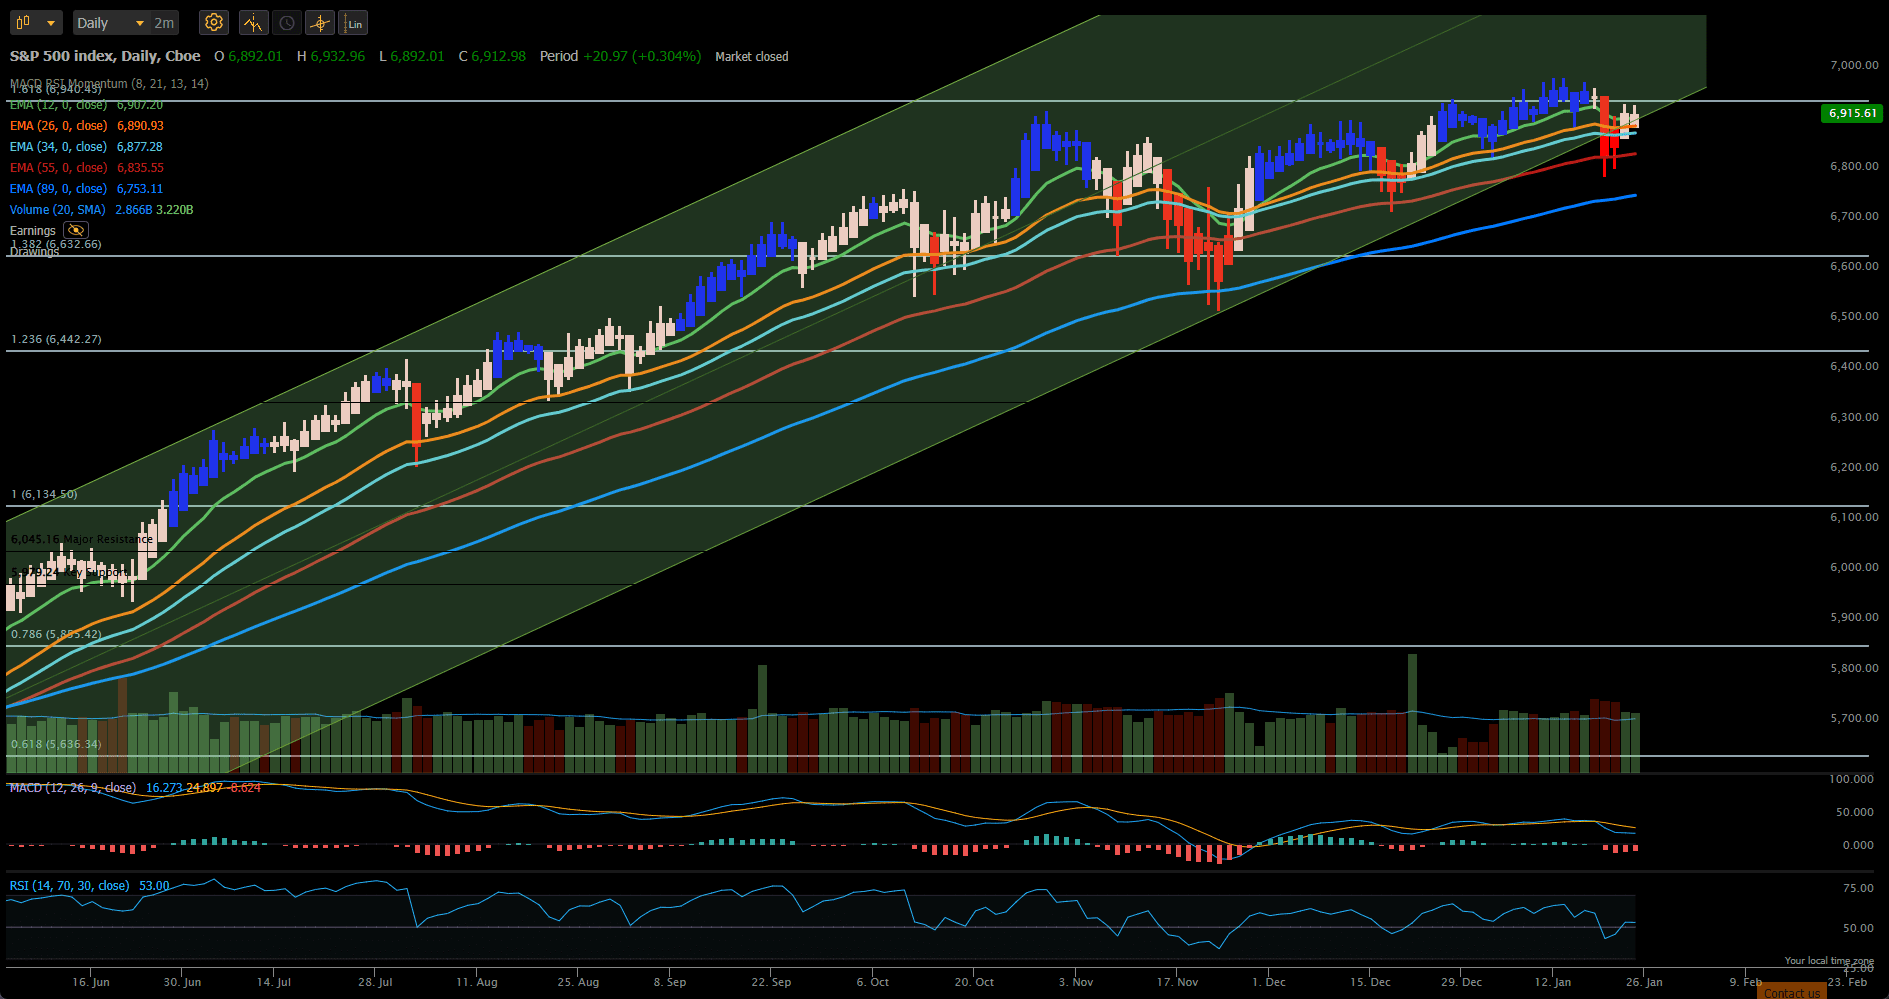
The SPX closed ~0.3% lower than last week’s close and is testing the lower boundary of the 9-month uptrend channel that began in April 2025. Shorter-term Exponential Moving Averages (EMAs) are turning over and threatening to cross below the longer-term EMA’s (a warning of a possible trend reversal) – all this in an environment of above average volume.
If we check the momentum and acceleration of SPYM (S&P Large Cap) ETF:
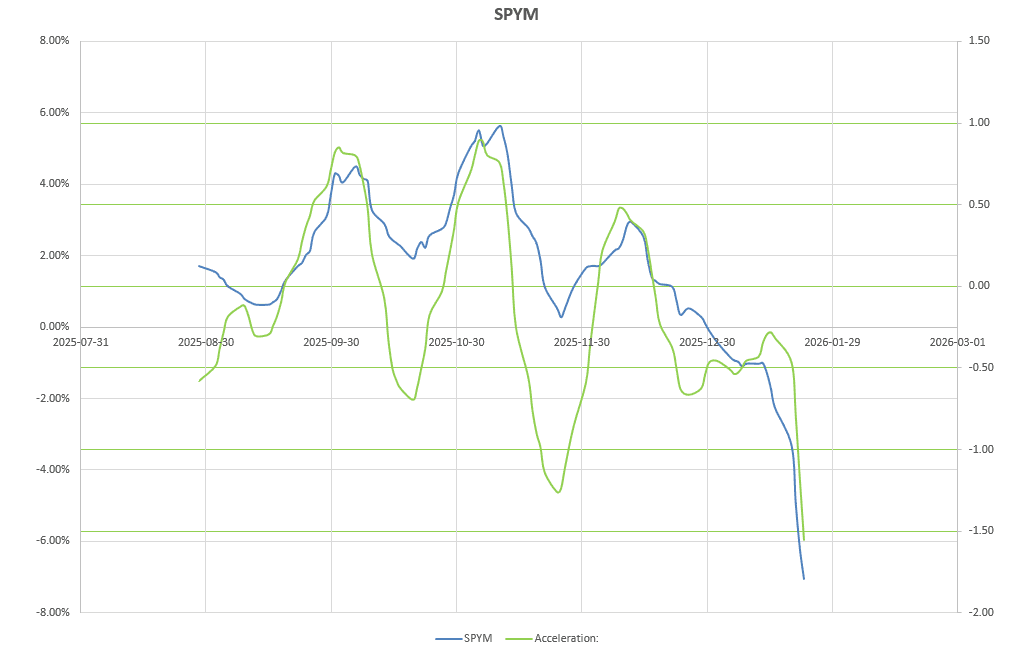 we see that both are presently in a strong downtrend in negative momentum and acceleration territory.
Compared to other major asset classes:
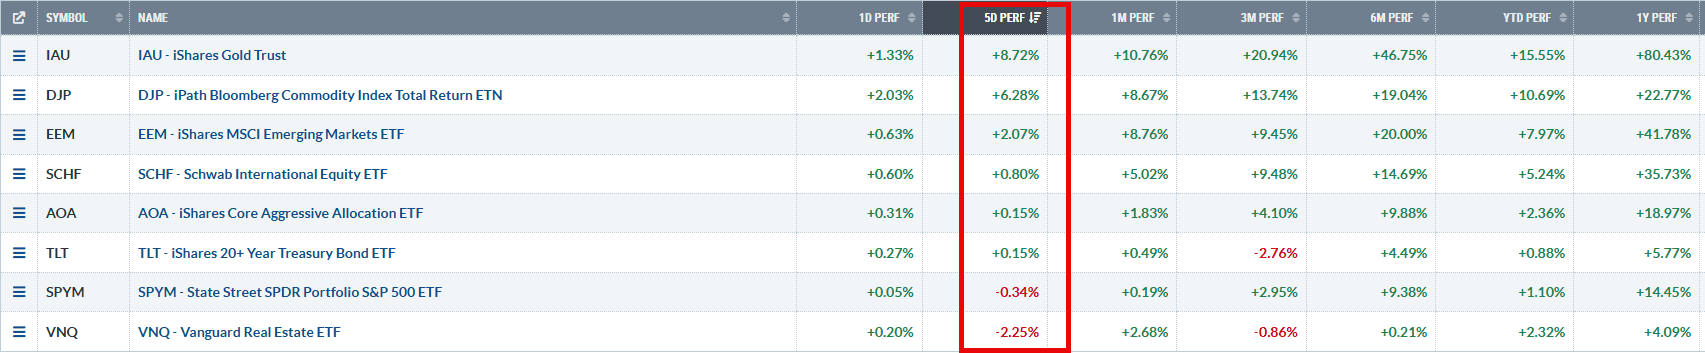 US equities fell towards the bottom of the list, only being under-performed by US Real Estate (VNQ). Gold continues to lead the way with an 8.7% return over the past week and an 80% return over the past 12 months. Commodities are also showing strength.
At present the Darwin portfolio looks like this:
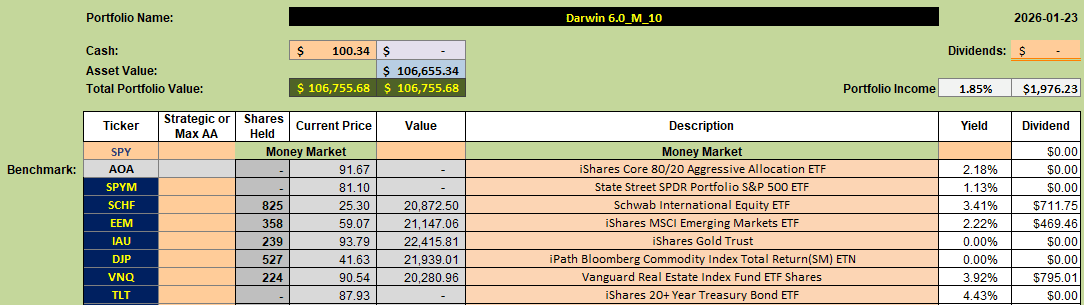 just about 100% invested equally between five of the seven ETFs in the quiver. Only US equities and Long-Term Treasuries are left in the quiver.
Checking the analysis sheet:
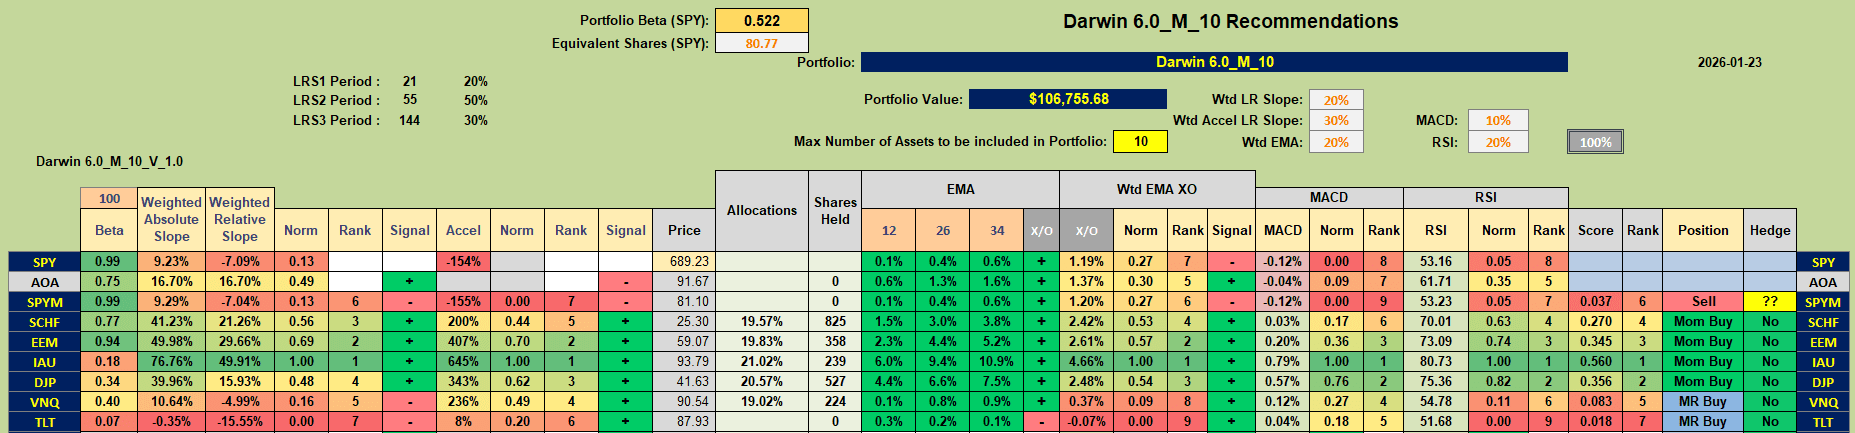 we see Momentum Buy Signals for SCHF (Developed Markets), EEM (Emerging Markets), IAU (Gold) and DJP (Commodities). Positions are presently held in all 4 of these ETFs so there is no adjustment called for there. VNQ and TLT are showing Mean-Reversion Buy signals – meaning that they are presently underperforming the benchmark AOA fund in terms of momentum but that this momentum is increasing with positive (short-term) acceleration.
Let’s take a look at the graphs. First we’ll check VNQ since this ETF is currently held in the portfolio:
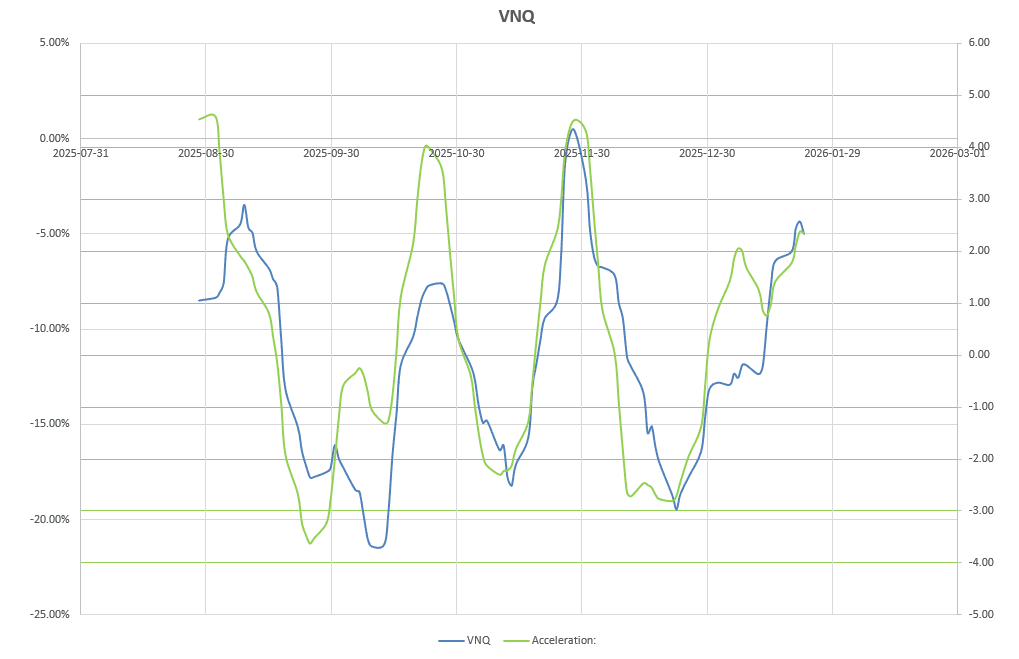 Momentum is negative (but rising) on positive acceleration – therefore this is still a hold for a Buy Low/Sell High trade since we are bottom fishing here. We need to be prepared to sell should acceleration turn negative – possibly/hopefully only with a small loss. At present, VNQ is showing an unrealized profit of ~$150 but had a losing week.
Now let’s take a look at TLT:
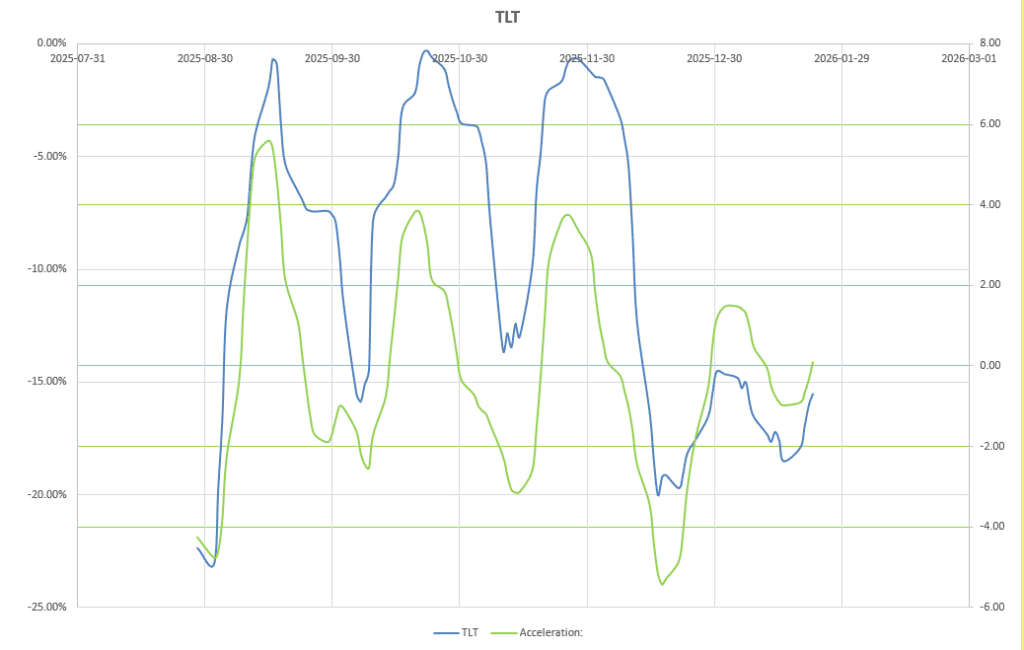 This ETF has shown downward momentum over the past five months but acceleration has just (on Friday) turned positive, thus triggering a Mean Reversion (bottom fishing) Buy signal.
If we check the allocation table:
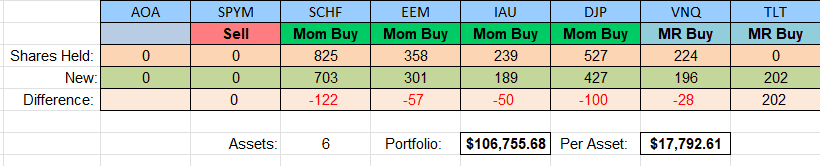 we see that if I were to purchase shares in TLT then I would have to sell shares in the five ETFs already held so as to raise cash for the purchase and to retain equal weighting. This is not necessarily bad since it would lock in some profits from those holdings. However it may also lead to slippage – so I don’t want to over-trade. At this point, I plan to watch the charts and recommendations and, should one of the assets switch to a Sell recommendation then I might switch that holding to TLT and retain the current equal weightings. Should the TLT graph show a continuation of the current strengthening then I may redistribute the monies, as in the above table, so as to retain equal (but lower) weighting but with more diversification.
Again, should I make adjustments before the next review, I will post in the comments section.
To date, performance of the Darwin Portfolio looks like this:
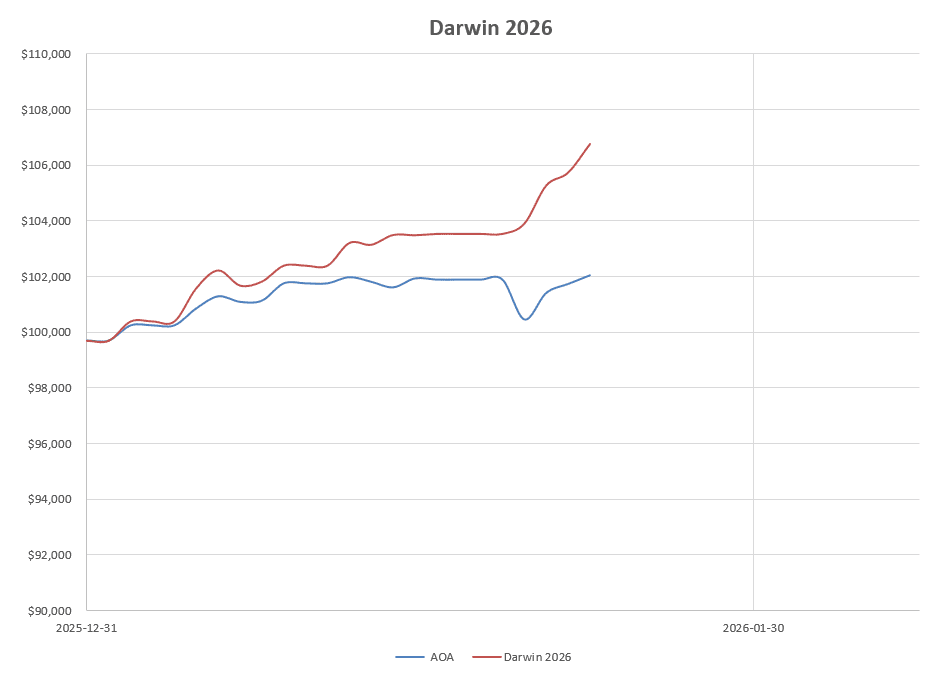 with a nice positive divergence from the benchmark this week due, primarily, to the fact that the portfolio is not holding a position in US Equities and is benefitting from the continued strength in Gold, Commodities and Emerging Markets. However, we know that no system does well under all market condition, so I would expect the gap to narrow at some point – but it’s a nice start. I am hoping that the inclusion of mean reversion trades into the algorithm will help balance out the pros and cons of both momentum and mean reversion systems. Time will tell.
Discover more from ITA Wealth Management
Subscribe to get the latest posts sent to your email.
Leave a Comment or Question