
Bray, Dublin, Ireland
As we move towards the mid-term elections it is appropriate that we recognize the historical significance of the “Presidential Cycle”:
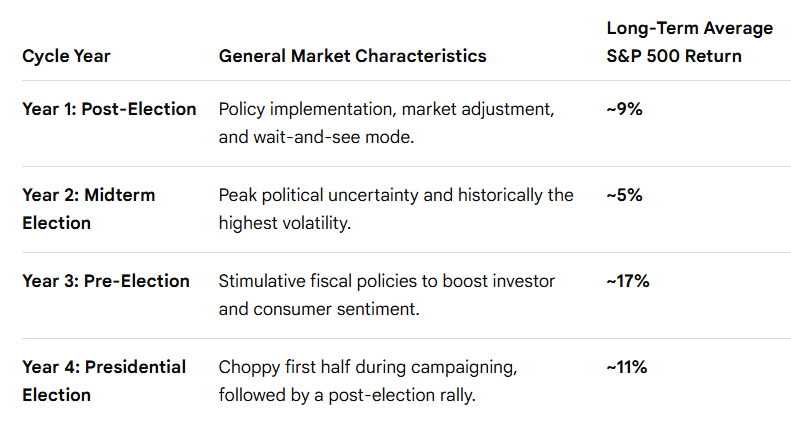 Thus, although most of us are very nervous that we are close to all-time highs in the SPX (S&P 500 Index), US Equities are up ~14% so far this year in a year that has historically been the weakest, averaging only 5%. Add to that the fact that the third year (next year in the current cycle) has been the strongest year historically with ~17% average returns and this leaves most of us scratching our heads here.
As can be seen from the chart:
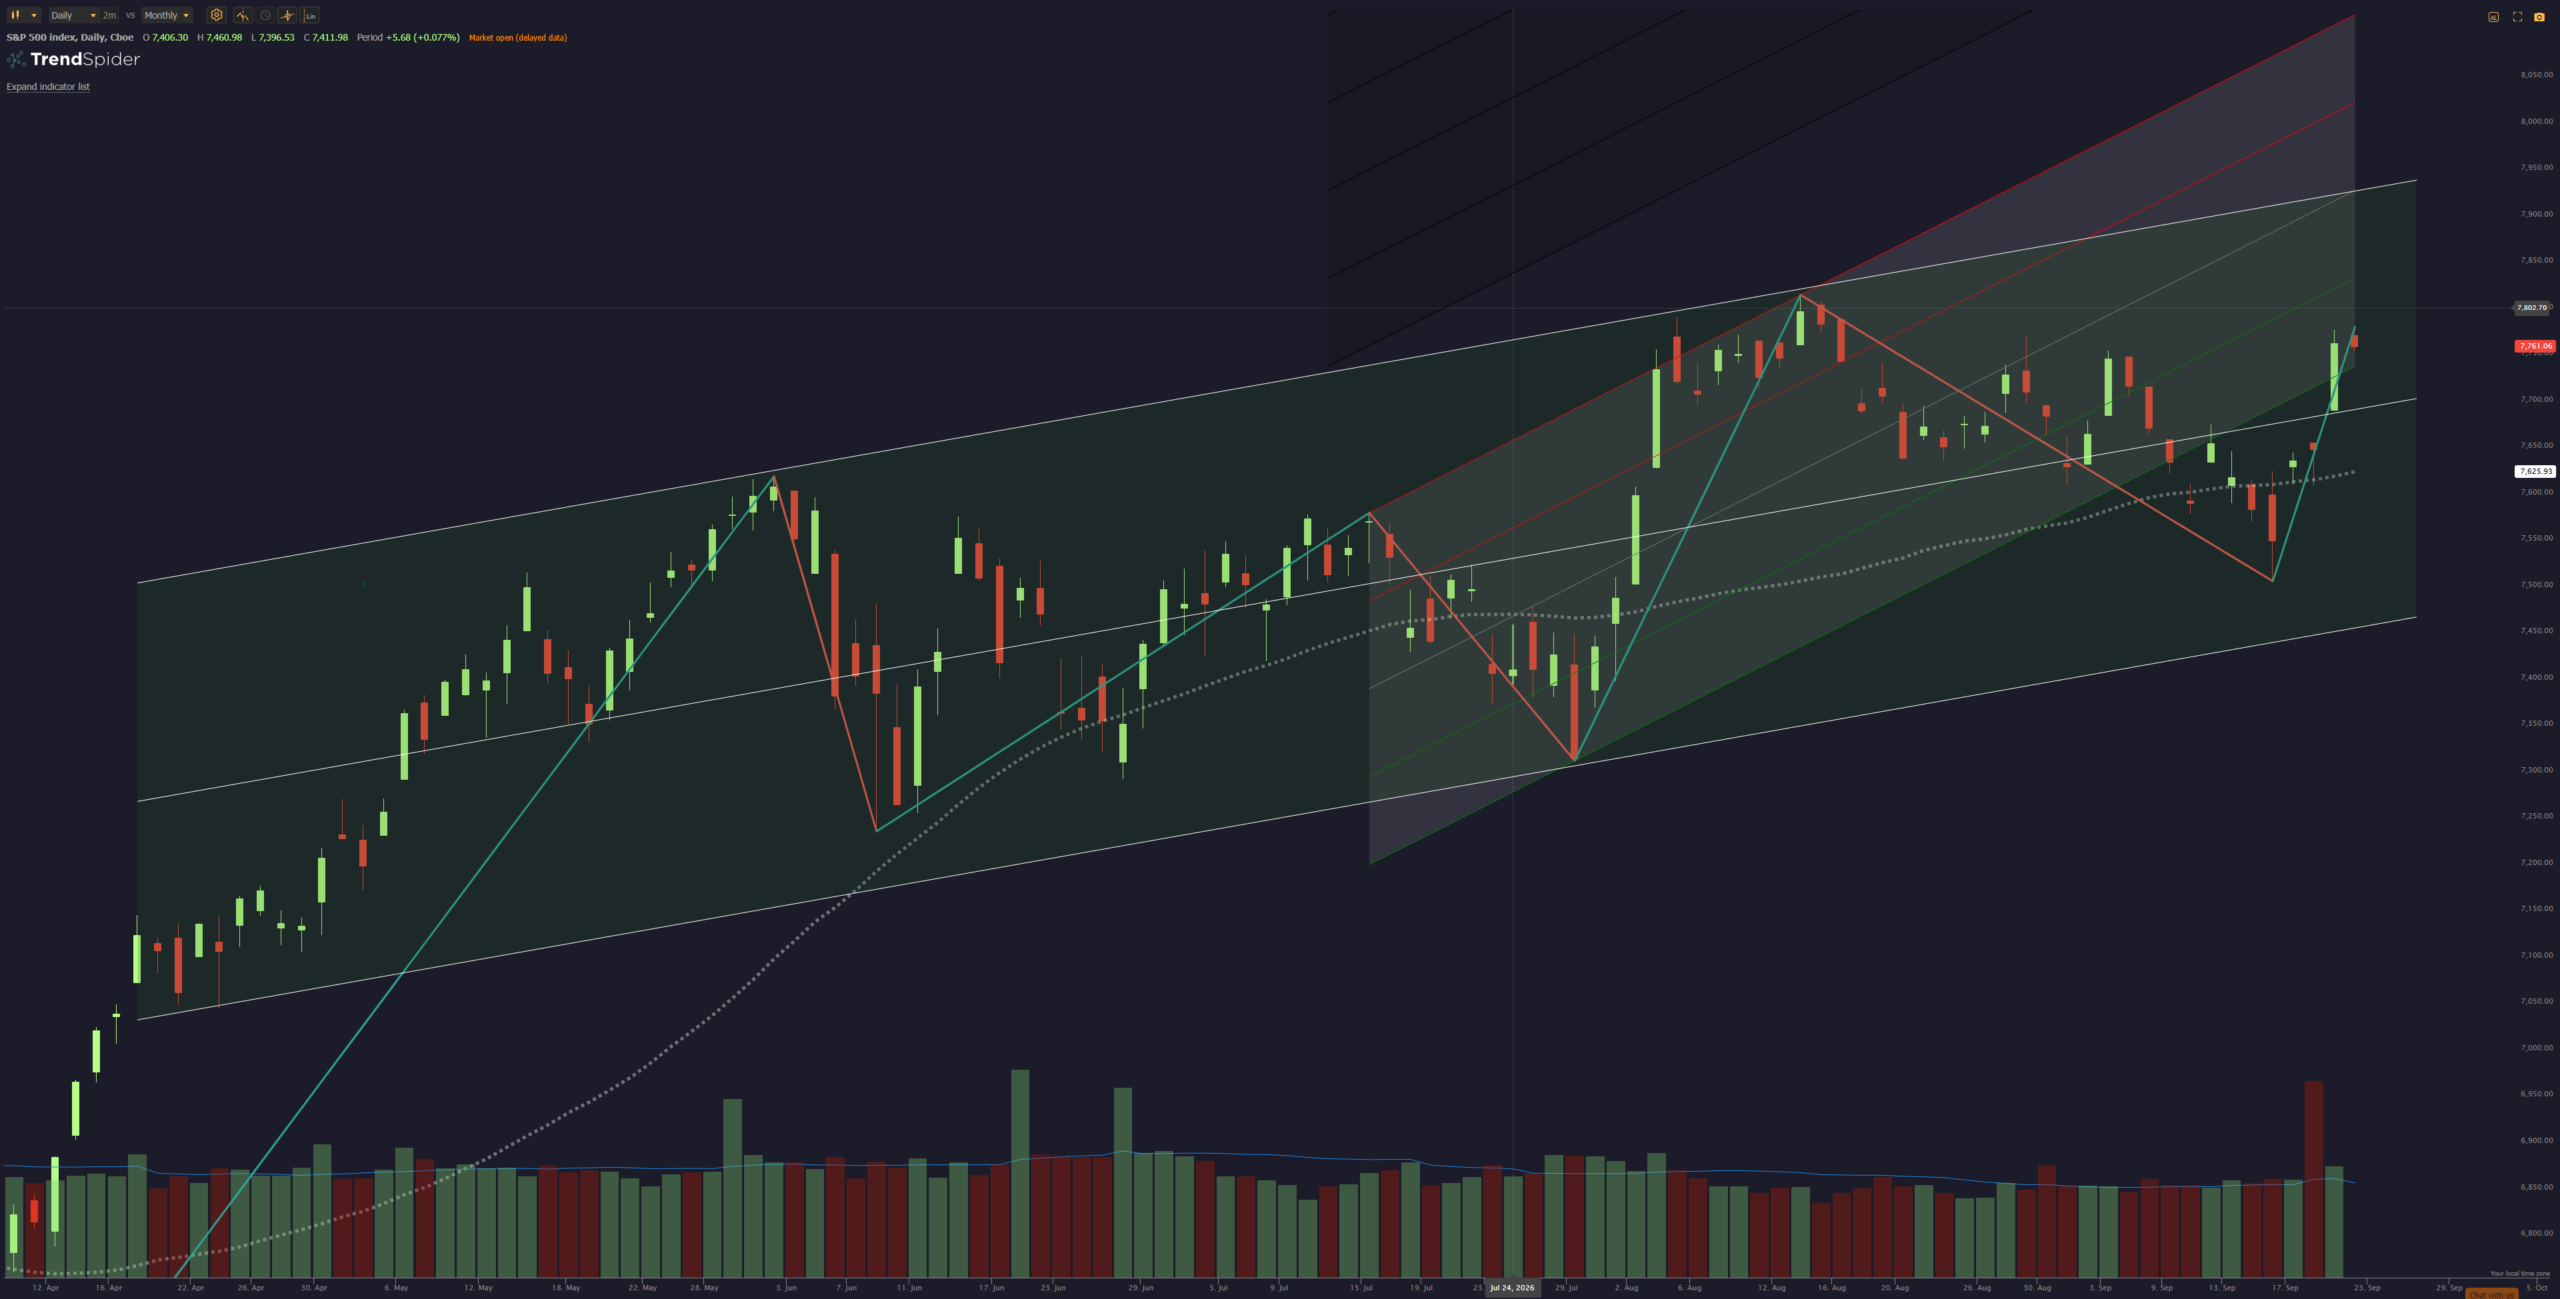 we are in a clear uptrend, and have been for many months.
The Darwin portfolio is a diversified portfolio that aims to rotate between major global asset classes to reduce volatility and risk – usually at the expense of returns – but lets us sleep better at night.
Performance to date, this year, looks like this:
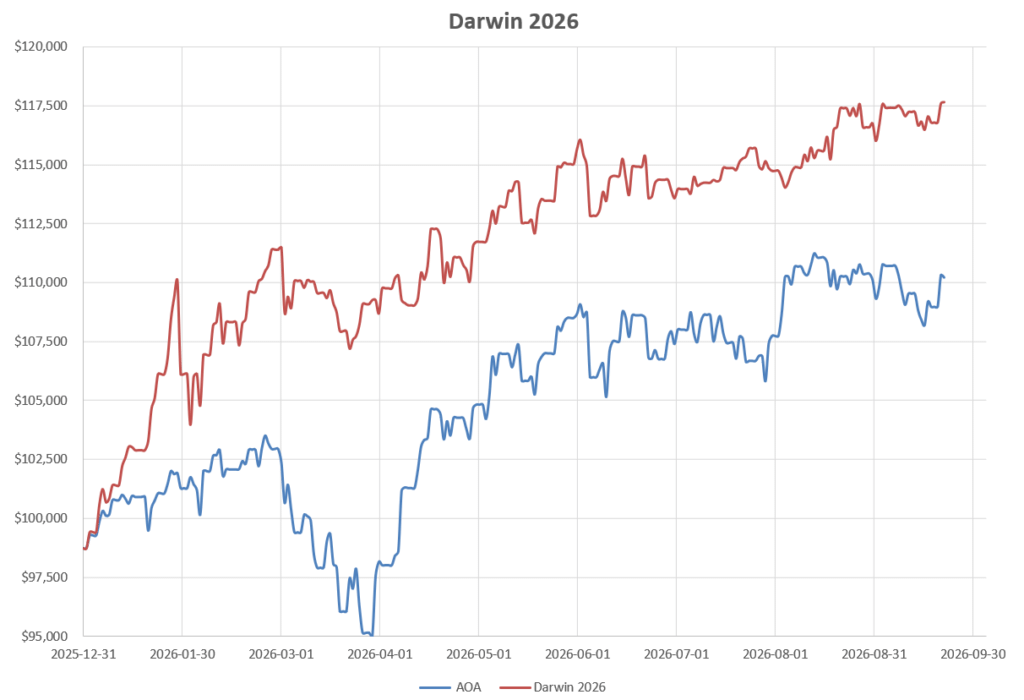 with a 25% Internal Rate of return (IRR) and beating it’s diversified AOA benchmark fund quite handily – primarily due to the fact that I was able to avoid the March “Tariff” scares.
The current analysis sheet that I have been using to manage this portfolio looks like this:
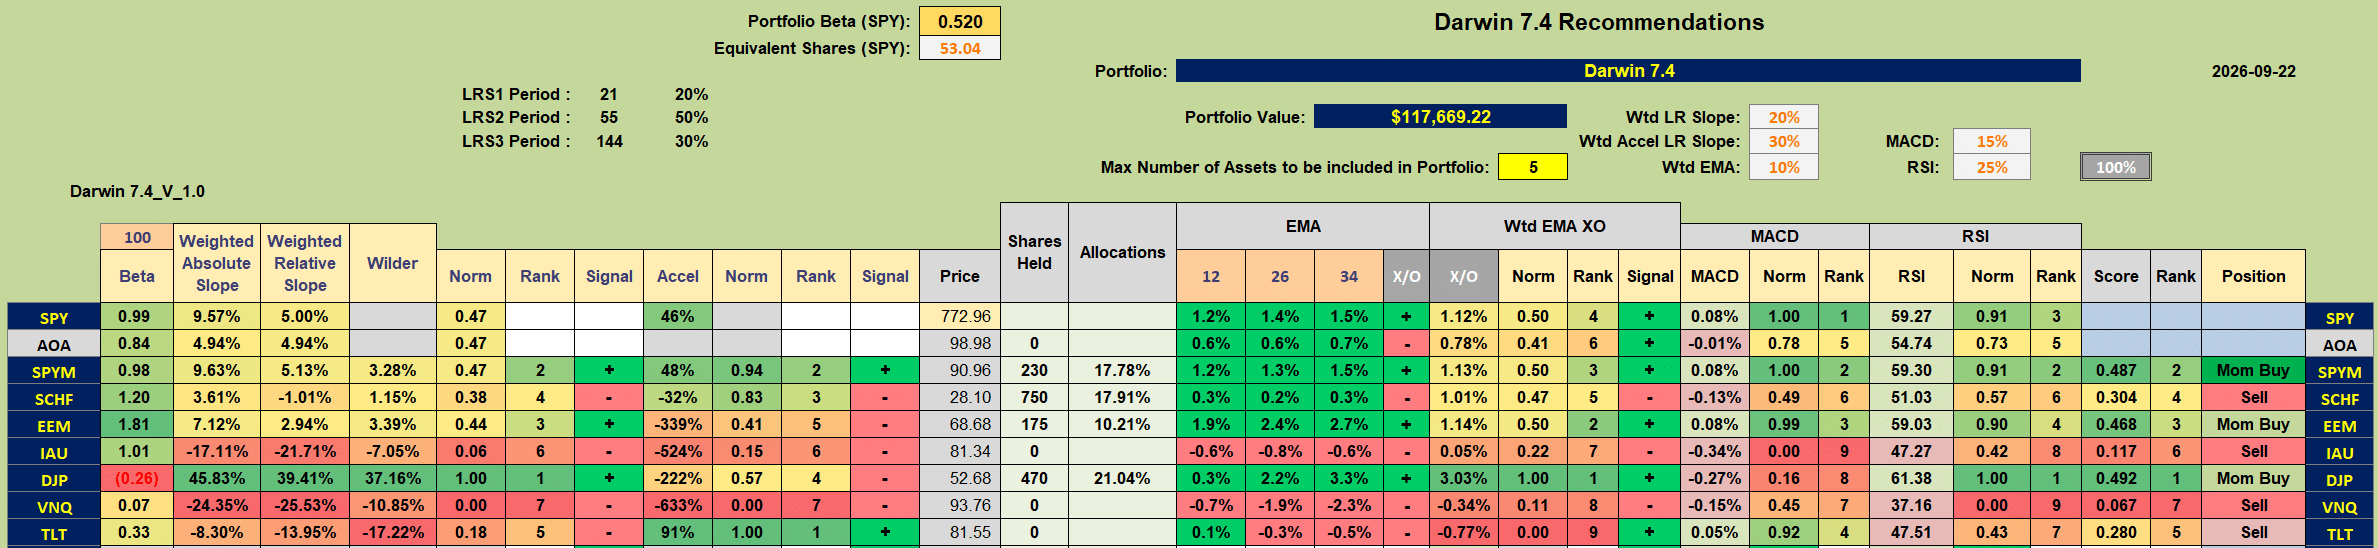 with Buy recommendations for SPYM (US Equities), EEM (Emerging Market Equities) and DJP (Commodities – led by Oil) and Sell recommendations for everything else. I am presently holding the three Buy recommendations plus SCHF (Developed Market Equities) in the Portfolio. Although I have been using this workbook as my primary tool for decision making I always check the charts for confirmatory evidence. At the moment the SCHF chart looks like this:
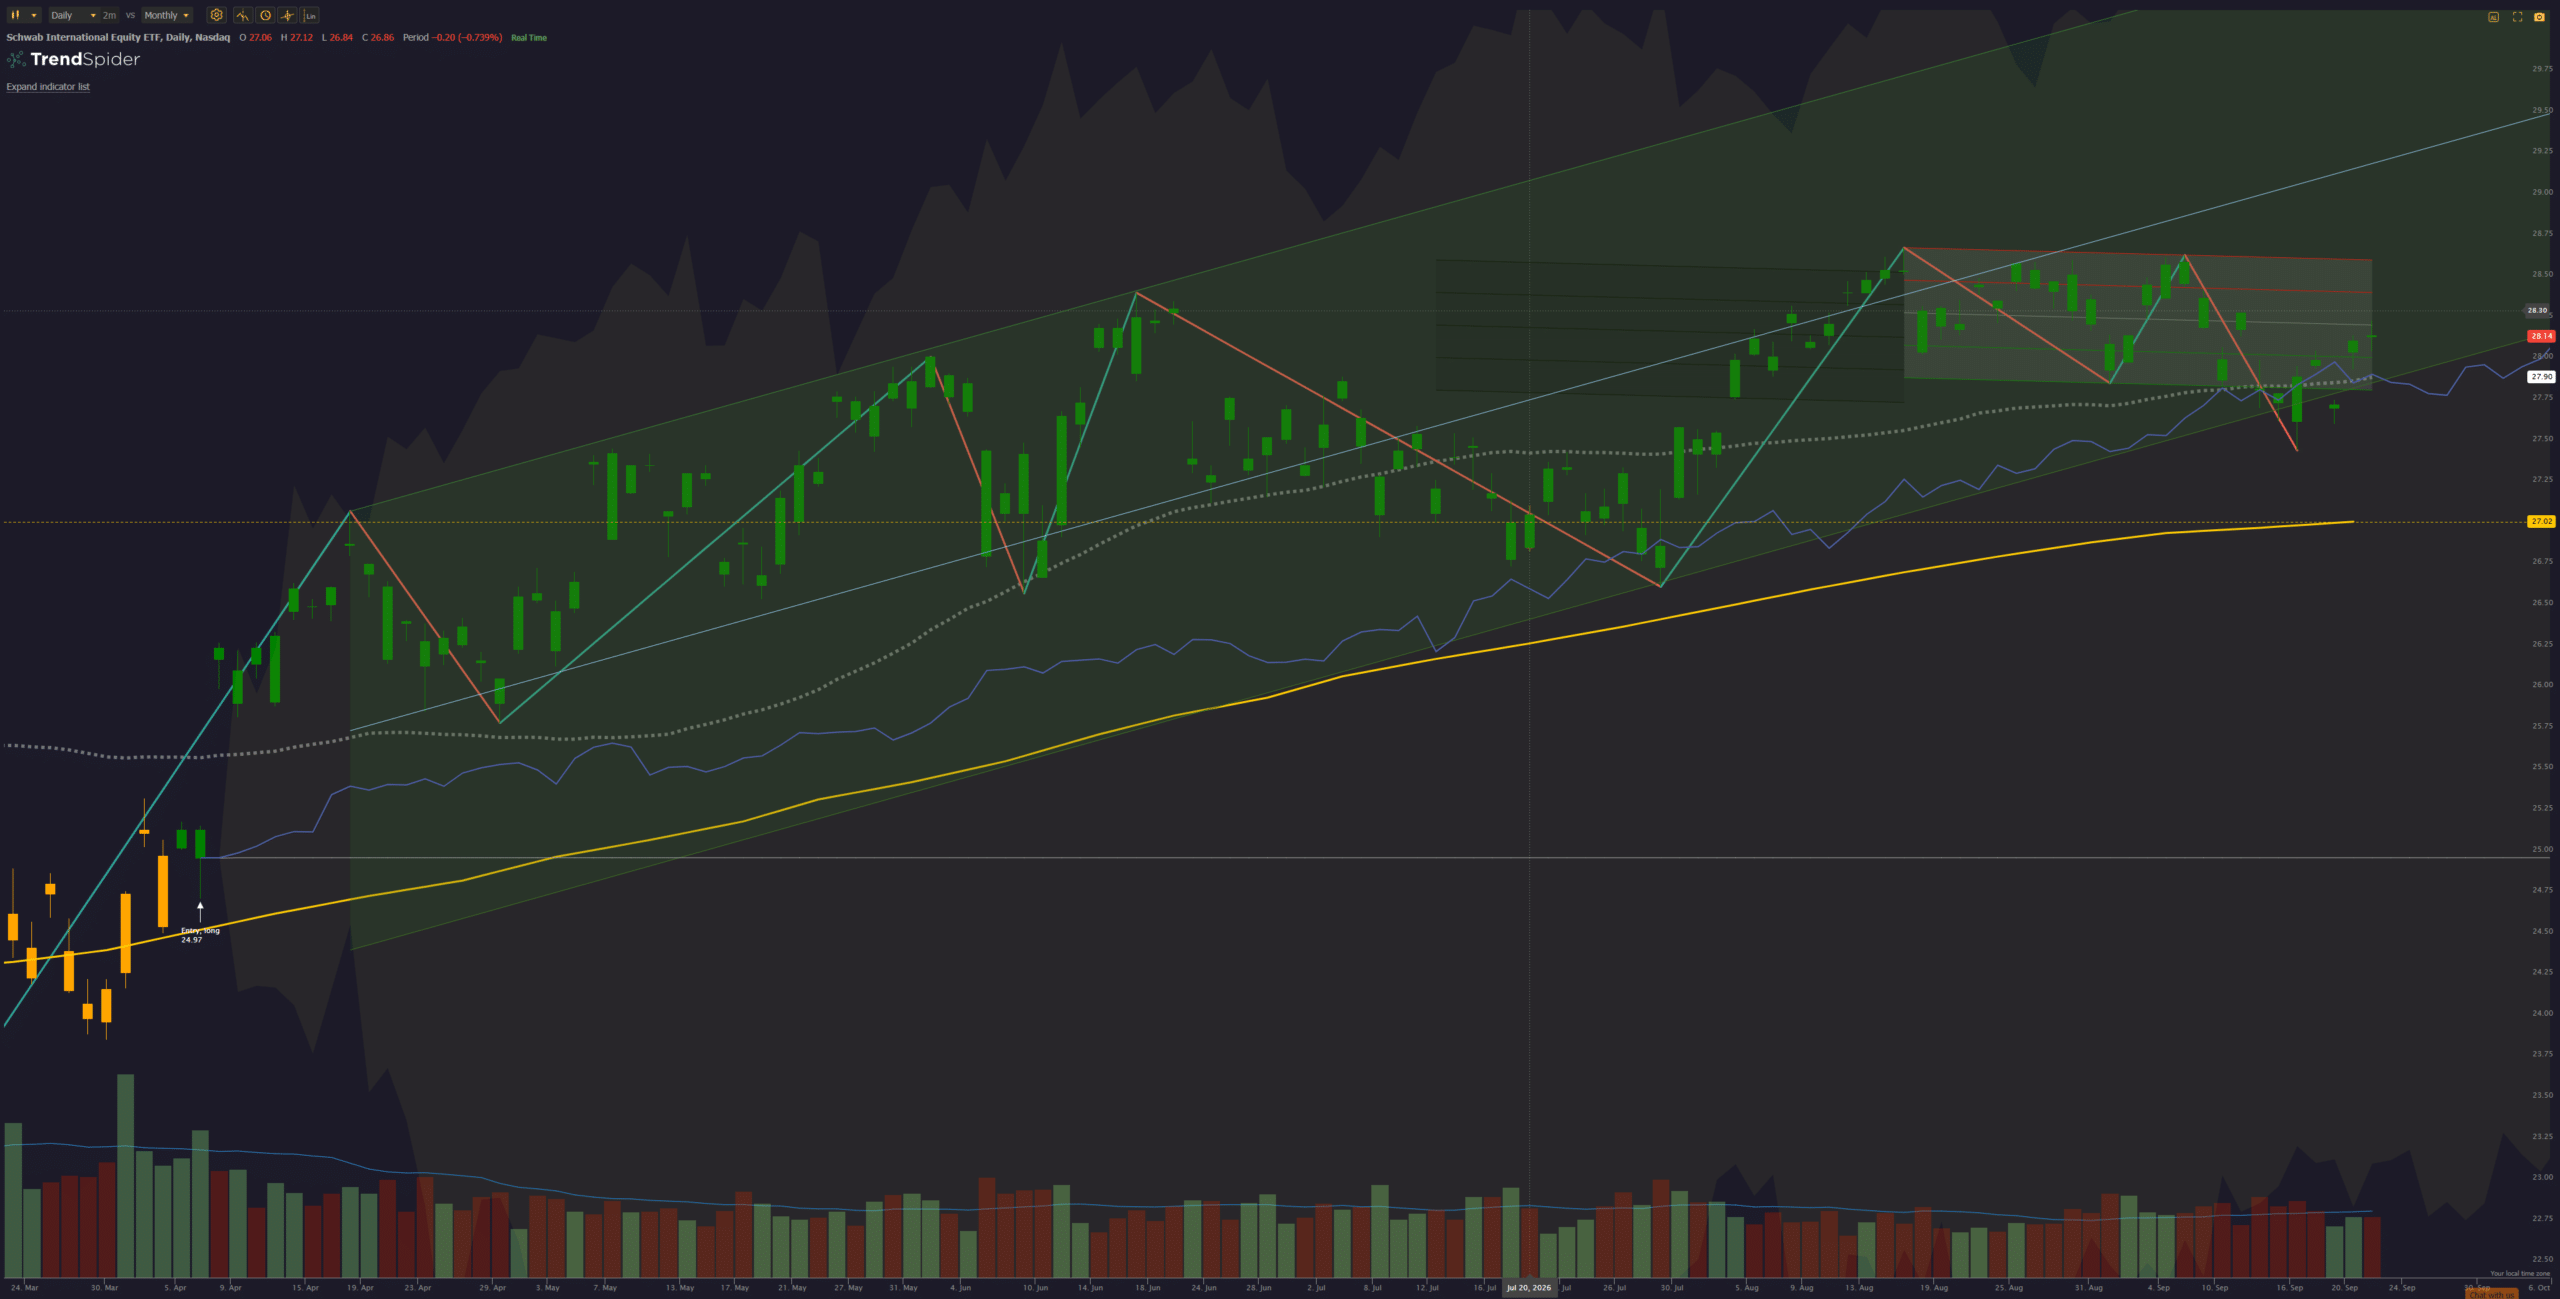 in an uptrend very similar to that of SPX for US Equities although severely testing the lower channel boundary, flattening out and, perhaps, preparing to roll over. So, there is no overwhelming reason to suggest that it should be sold here – but caution/attention is needed.
Although I try not to change my systems too often I do enjoy the research needed to build and test these systems – and I am an avid reader of books on investment and trading, with a substantial library (some of which I had to trim (: when I moved from a house to a Condo). I recently found a book – written in the late 1980’s (don’t know how I missed it until now), written by Stan Weinstein, that I would certainly recommend to anyone interested in simple, straightforward, technical analysis – it only uses Simple Moving Averages (SMAs). The book is obviously a little outdated in terms of illustrated examples – but the basic concepts are solid. The book is inexpensive (in paperback) and available at Amazon – it’s title is “Secrets for Profiting in Bull and Bear Markets”. After reading the book I spent a few days working with Claude (AI) to setup systems and backtest them – work that would have taken me months/years without Claude’s help. Of course, as we know, no system works in all market environments – and there is no exception here. I set the goals to minimize drawdown at less than 20% with a minimum number of knobs to twiddle (parameters to adjust) so as not to obviously optimize/show bias. Generally it worked well, handling the 2008 financial crisis very well and even the 2022 correction – both of which were relatively slow declines with plenty of time to exit poorly performing assets. However, it did not handle “flash crashes” well (e.g. 2020 Covid crisis) because of the “impulse” timing . With hindsight this would not have been a big problem because these were V-shaped dips/corrections of (relatively) short duration (< 12 months) – but, of course we don’t know what the recovery time will be on any future corrections and we need to be more cautious as we get older since we need to have time to recover.
Without going into a lot of detail, Weinstein’s systems define four “stages”. Stage 1 is a sideways consolidation phase and this is followed by a bullish breakout into Stage 2. At the end of this bullish phase we move into another consolidation phase – Stage 3. From there we may see one of two things
- a breakbown into a bearish Stage 4 and completion of the cycle until the next (Stage 1) consolidation phase, or
- a continuation of the Stage 2 bullish phase
For a long-only portfolio we obviosly want to be in the Stage 2 bullish phase with caution warranted as/when we move into Stage 3. Stage 4 is an obvious no-go.
I have also been able to run one of these systems in my TrendSpider charting platform and the above chart for SCHF shows the chart with green candles signalling that we are currently in Stage 2 and should be long. Because we know the cycle we know that the next color change (that happens to be yellow like the bars at the left side of the chart) will take us into Stage 3 and that we should be prepared to exit. If we then see a continuation pattern (return to green) we may encounter a whipsaw loss, but backtests have shown that this is generally overidden by the next bullish Stage 2 profit.
All this to explain why I am holding on to SCHF until I see a yellow candle 🙂
For anyone that might be interested, that yellow line in the above screenshot is the 30-week (~150-day) SMA and the white dotted line is the 50-day SMA. Hanging around in this 50 SMA area is another indication that we may well soon move into Stage 3.
The review this time has been a little different from previous reviews as a result of my changes in “confirmation” – but, at this point I am not moving far my existing practice of checking the workbook recommendation and confirming on the charts.
If there is anything that I have not included that you found useful (e.g. weekly performance numbers for the assets in the portfolio) let me know and I can put them back in – I’m just trying to keep the posts as short and readable as possible.
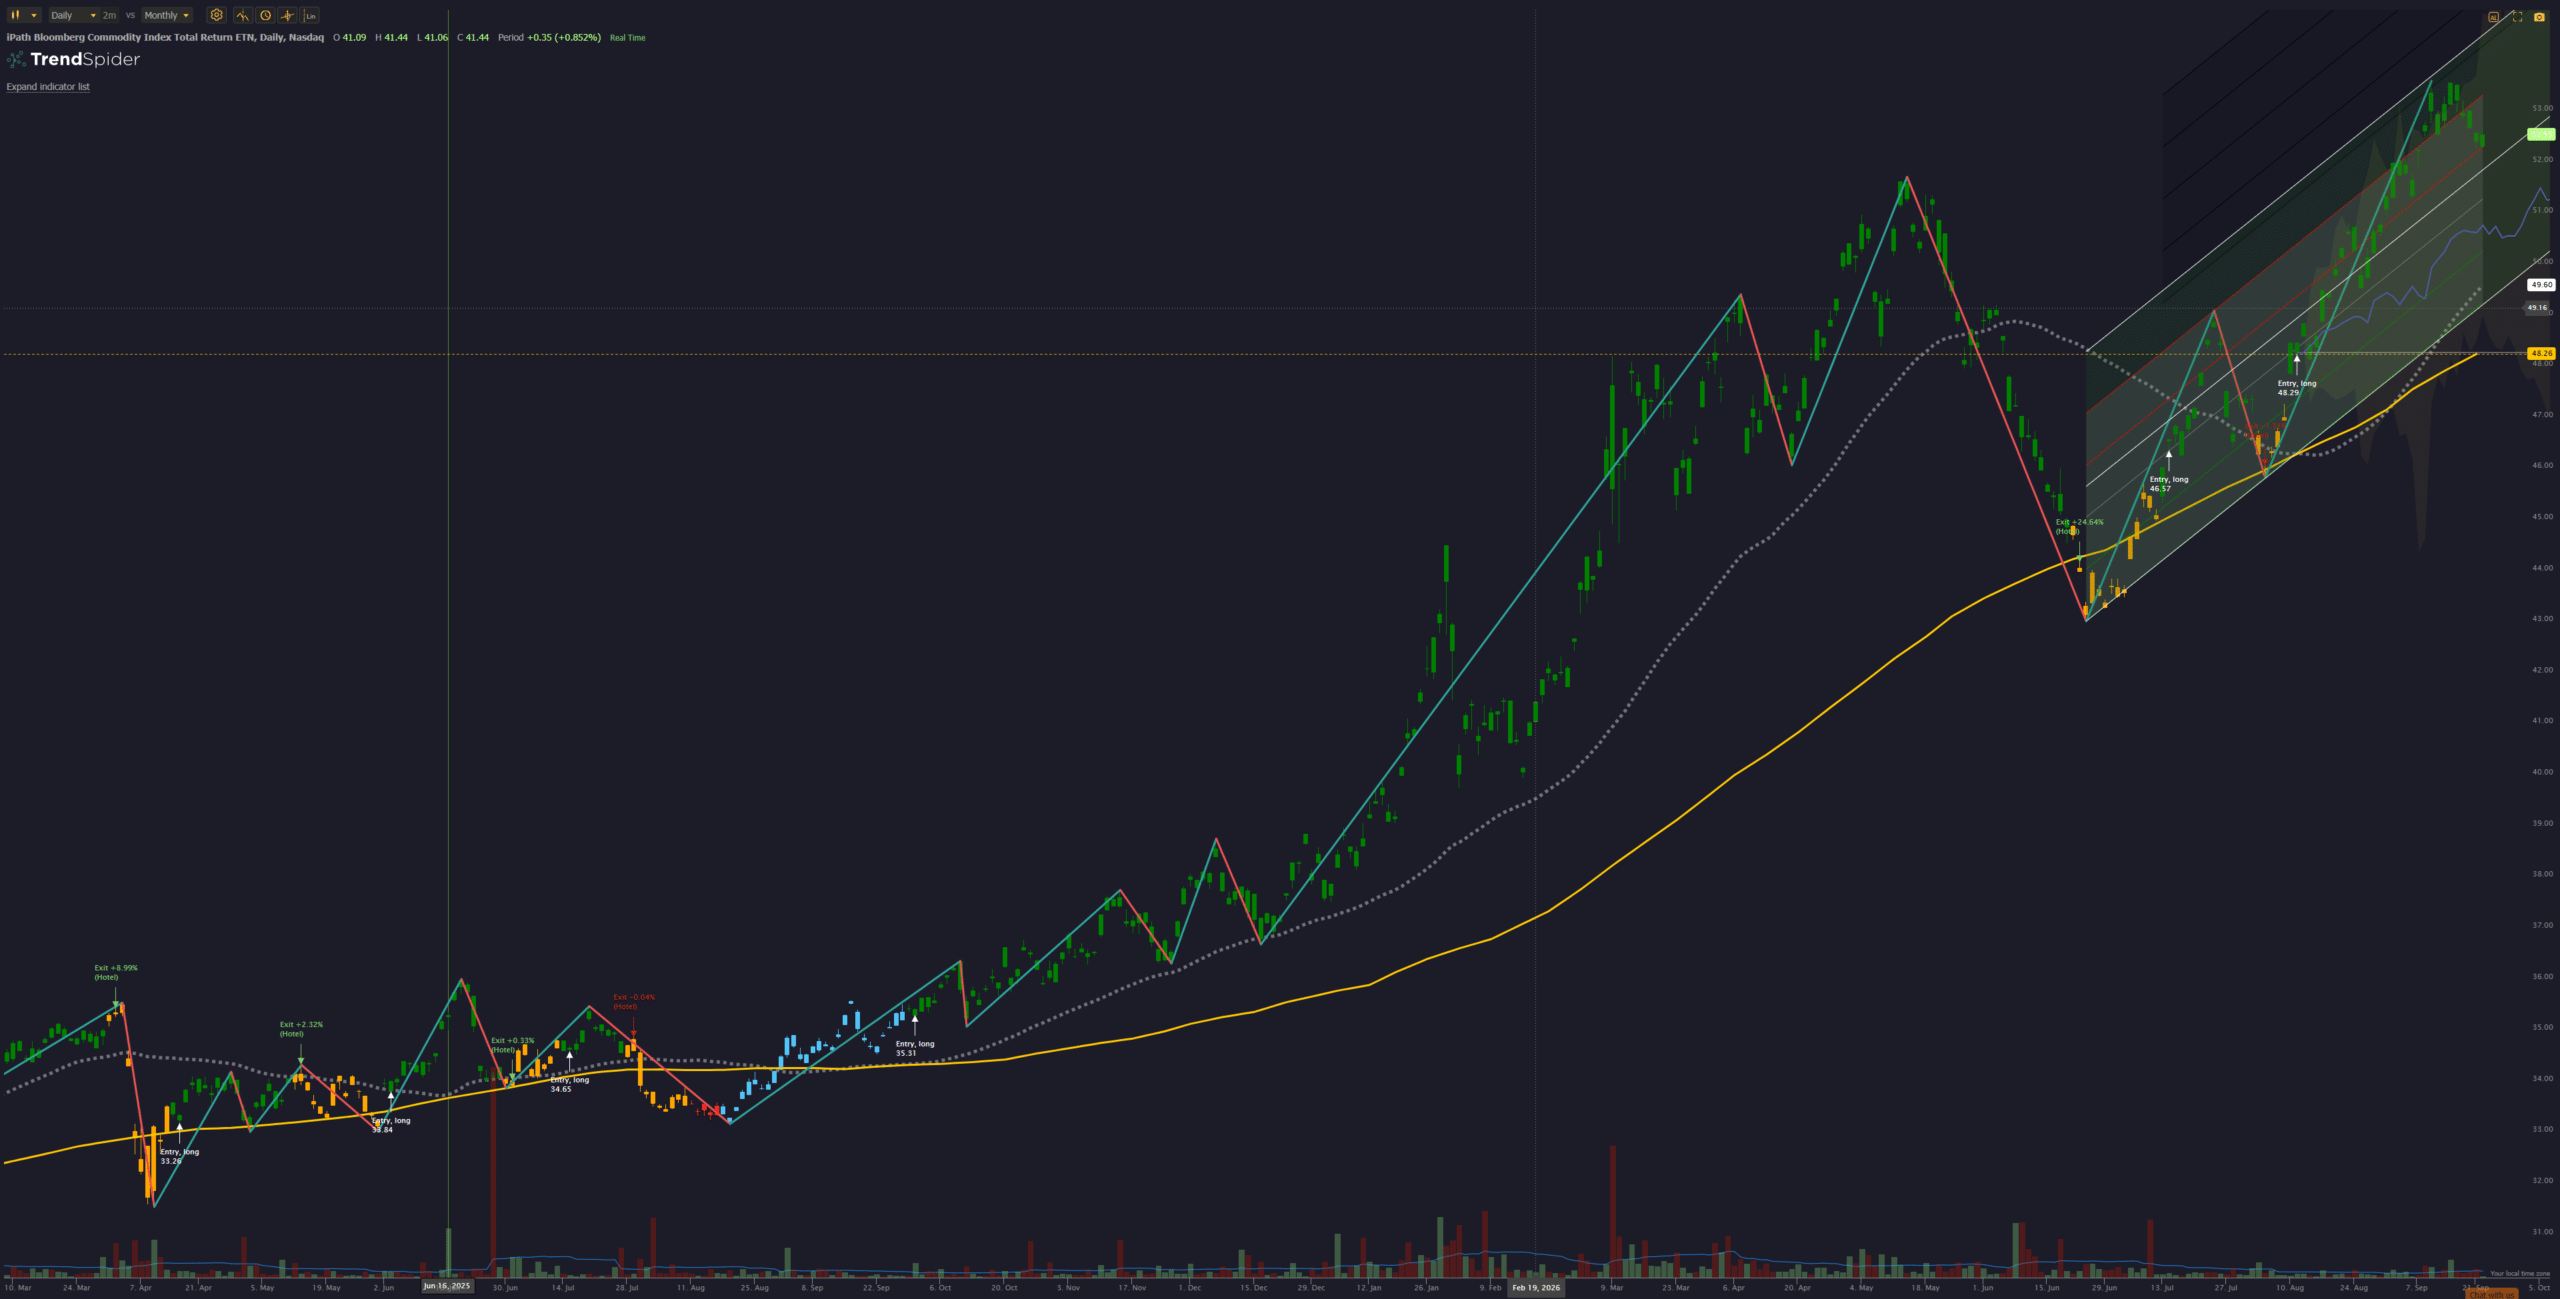
Just for the sake of completeness the following screenshot shows the chart for DJP over the past ~18 months and shows the 4 different stages. Stage 1 – light blue, Stage 2 – green, Stage 3 – yellow and Stage 4 – red (only 5 bars in Aug 2025).
Discover more from ITA Wealth Management
Subscribe to get the latest posts sent to your email.
Leave a Comment or Question