
Adamski Effect of hiker in snow.
Franklin is the Sector BPI portfolio up for review and included in this blog post is additional Kipling SS information for those new subscribers using this spreadsheet. The Franklin has been using the Sector BPI model for roughly a year so we are beginning to build useful data, although one year in the stock market is a very short period. The Carson is the oldest Sector BPI portfolio so reference it from time to time for additional information.
Reported to me this morning is good news for Mac users. The Kipling SS works with the Parallels software on the Mac. If there are further questions, I suggest interested investors use the Forum to conduct this on-going conversation.
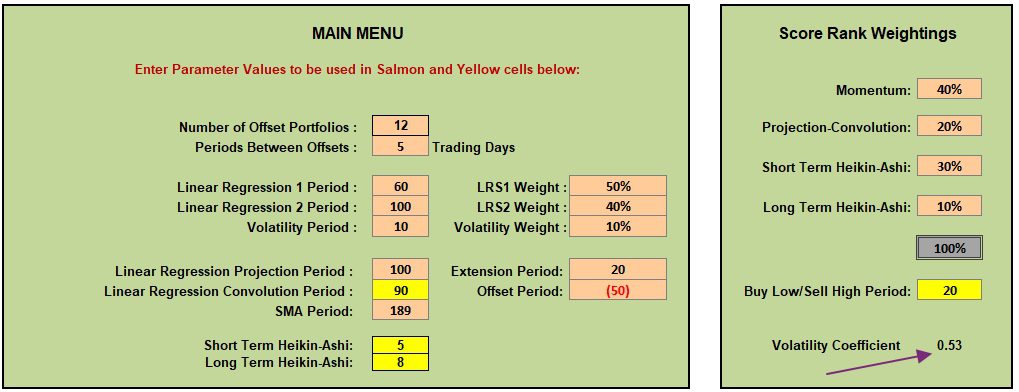
Main Menu Settings
Someone recently asked about the Main Menu settings. The variables shown below are very close to the “default” settings used when this spreadsheet was tested several years ago. The only variables I ever alter are the Linear Regression 1 and 2 Periods and the LRS1, LRS2, and Volatility Weight. The current settings are working quite well for the Sector BPI portfolios.
The purple arrow points to a Volatility Coefficient. This value adjusts the sum of the volatilities of the eleven sector ETFs to add up to close to 100%. The Volatility Coefficient impacts the sector percentages that you will see in the second screenshot.
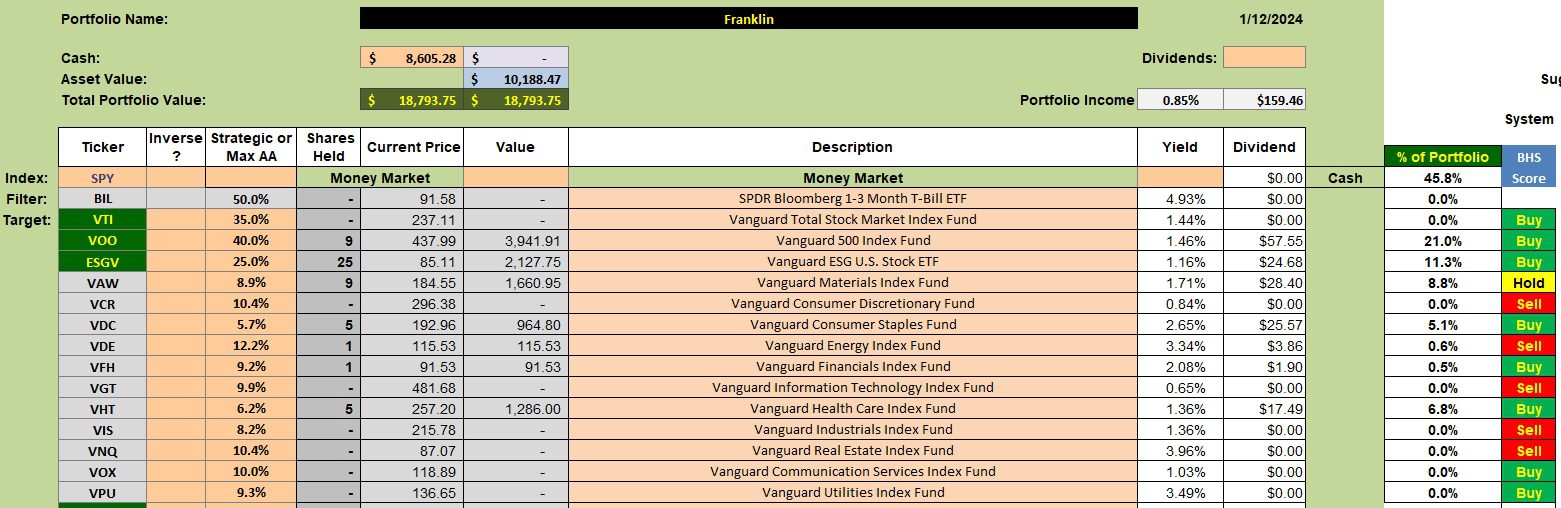
Franklin Security Holdings
Here we have the investment quiver and current holdings for the Franklin. The Volatility Coefficient, mentioned above, adjusts the percentages for VAW down through VPU so the sum is 100%. The percentage recommended for a sector, when it comes into the Buy zone, is based on a three-year volatility average. The more volatile the sector the higher the percentage for investment.
As an example, VDC (Consumer Staples) when a Buy is to hold 5.7% of the portfolio. If you move to the second column from the right you will see that VDC currently holds 5.1% of the portfolio. Keep in mind that VDC is currently in the neutral zone. It is neither a Buy or Sell so it does not currently carry a TSLO setting.
If all the sectors suddenly dropped into the oversold zone I would sell all equity holdings in VTI, VOO, and ESGV and move that cash into the sector ETFs according to the recommended percentages shown in the third column from the left.
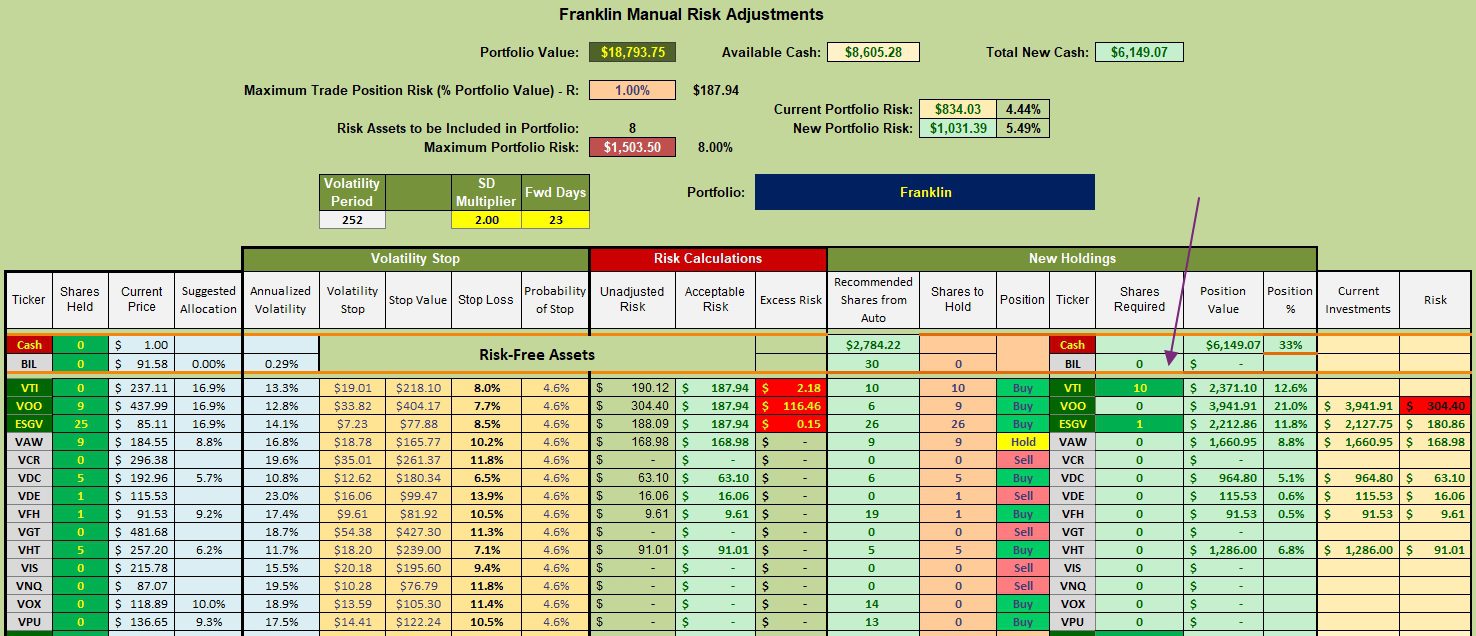
Franklin Manual Risk Adjustments
Once more, the SD Multiplier is set in the Position Size (Auto) worksheet to 2.00 and that value is linked to the Position Size (Manual) worksheet you see below. Your SD Multiplier value will most likely differ from the 2.00 shown below. The other risk setting I vary is the Maximum Trade Position Risk. Again, this is adjusted in the Auto worksheet and the value is linked to the Manual worksheet. While discussing these details, I highly recommend saving the Kipling SS under that name and then renaming the spreadsheet you use to manage your own portfolio(s). If something becomes corrupted you can go back to the original Kipling.
Back to the Franklin. The recommendation is to add 10 shares of VTI and one share of ESGV. Since beginning this article, one limit order to add 5 shares of VTI hit the target price. Limit orders are still in place to add another 5 shares to VTI and one share to ESGV.
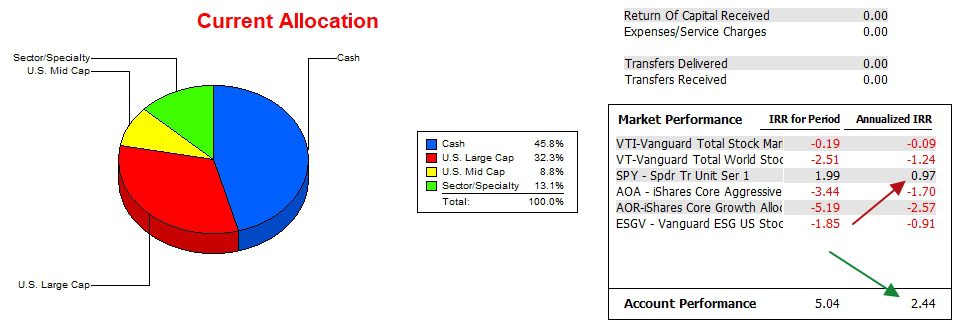
Franklin Portfolio Performance
The following data is for a little over two years. The Franklin has a small lead on the SPY benchmark and a larger margin on any of the other five potential benchmarks.
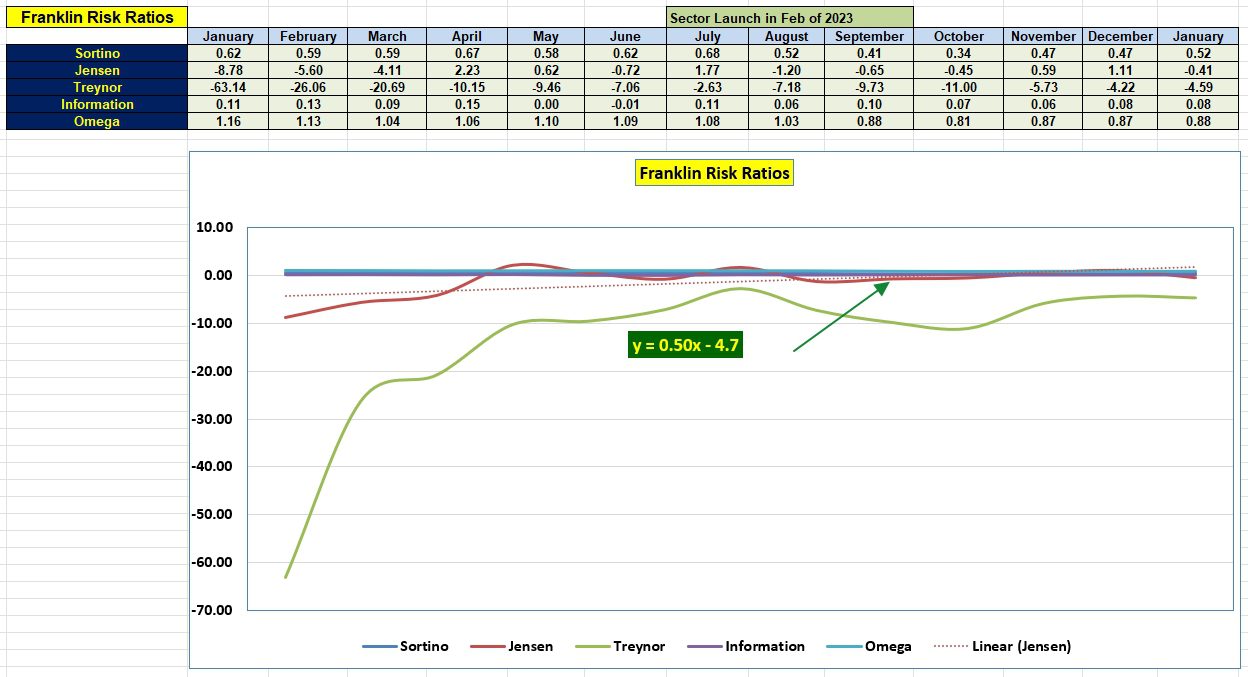
Franklin Risk Ratios
Now we come to the risk measurements and here is some interesting data. While the Franklin is outperforming the SPY benchmark, the Jensen Alpha is negative. In other words, the Franklin is not adding alpha due to some internal risks. One major factor is the interest rate for a risk-free short-term treasury. I use SHV and the current interest rate is 4.73%. In a sense, the Jensen is telling us that with a risk-free interest rate of 4.73% it makes little sense to be in the stock market. Or one better be performing well above the risk-free interest rate.
The Jensen Performance Index includes these four metric so readers know what goes into this calculation.
- IRR for the portfolio.
- IRR for the benchmark.
- Short-Term interest rate for SHV. SHV is my choice.
- Beta of the portfolio. The Kipling automatically calculates the portfolio beta.
Some good news is that the slope of the Jensen is positive. Rather than focus on a single value, pay attention to the growth rate.
Franklin Portfolio Report
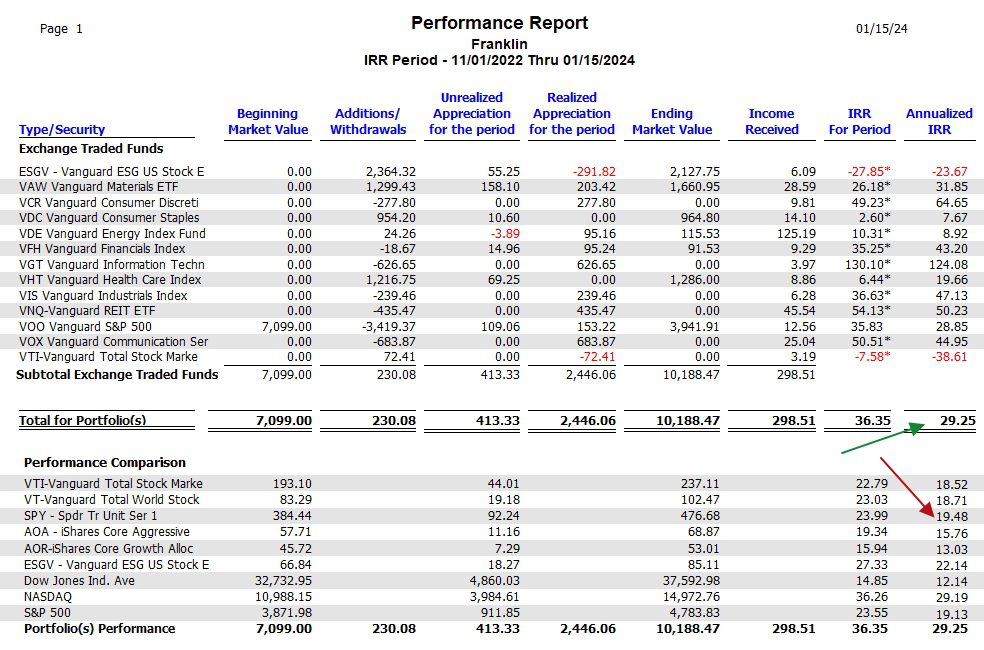
The following report goes back to a period just prior to switching the Franklin to the Sector BPI model. Over the dates listed below, the Franklin holds a ten percentage point advantage over the SPY benchmark ETF.
Over this same period the NASDAQ shows a similar gain indicating technology was the place to be. VGT only underscores this point.
If the following data is useful information, let me know. I don’t always post it as it does require a little more work to put together.
Comments and Questions are always welcome.
Discover more from ITA Wealth Management
Subscribe to get the latest posts sent to your email.
Two more portfolios are scheduled for review this week. They are: Gauss and Millikan. A delay may occur.
A major ice storm is headed our way and is to begin around 3:00 p.m. and last through the night. Assume we lost EE if you are unable to contact me for the next 24 to 48 hours.
Lowell