
Autumn in Oregon
Gauss is another portfolio using the Asset Allocation Model of investing. This has been a brutal week for U.S. Equities as the S&P 500 is down another one percentage point as I write this blog. We may be near the beginning of a market correction if not worse. I thought the correction (down at least 10%) would occur in 2026 rather than near the end of 2025. However, tariffs are beginning to kick in and consumers are beginning to feel the pinch.
It is obscene for Individual-1 to be holding a “Great Gatsby Dinner” exactly at a time when the SNAP program to feed the poor is cut off. Government shutdown, job reductions, inflation on the rise, food prices up, and the general lack of economic data due to shutdown is likely to eventually have a negative impact on the market. For these reasons I am parking cash in short-term treasuries (SHV) while waiting for better buying opportunities.
Gauss Menu
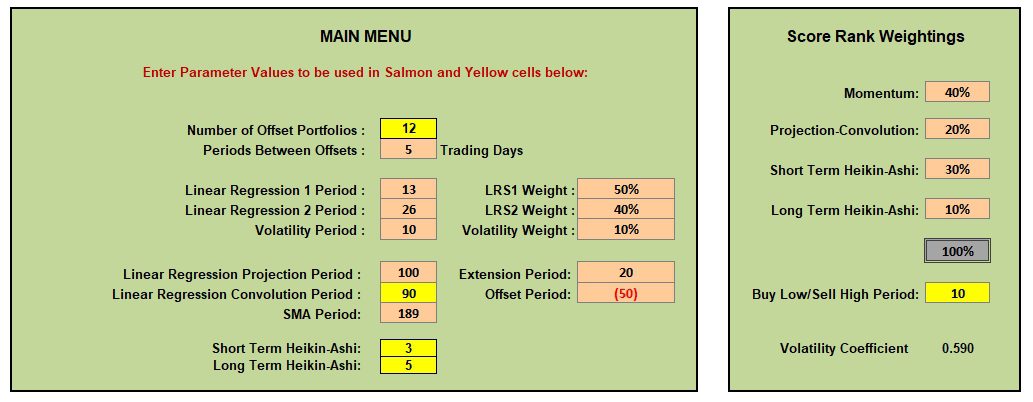
Rarely do I post the Main Menu worksheet that is an essential part of the Kipling spreadsheet. Below is the menu so readers can see the short linear recession periods I am using for all portfolios.
Note the 13 and 26 day Exponential Moving Average time periods. I am using these short periods to react quickly to market moves.
Gauss Asset Allocation Model
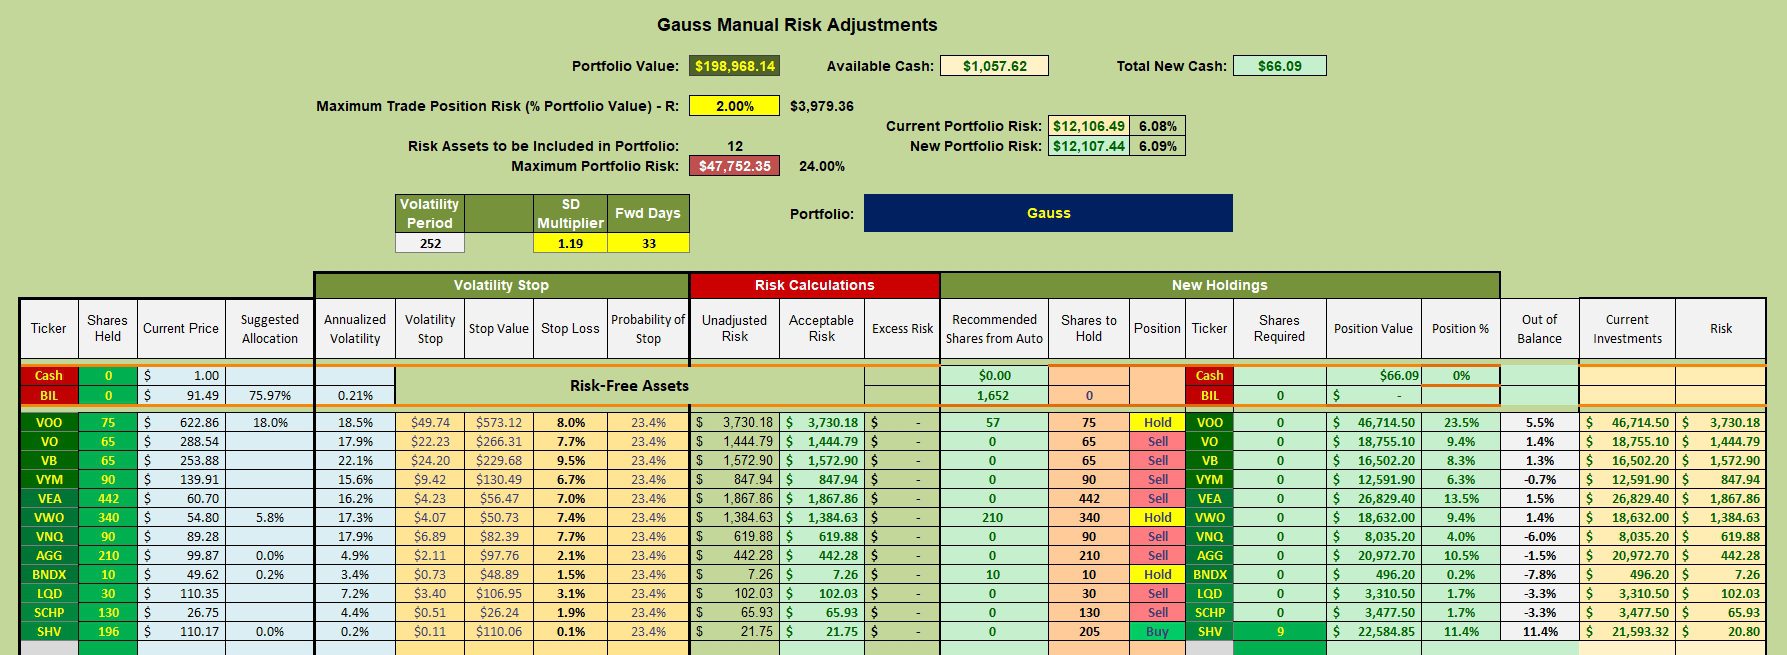
Below is the current asset allocation setup for the Gauss portfolio. I am guessing we will make it through 2025 before we see too much of a draw-down, but this is only a guess. Otherwise I would be selling shares of VOO to bring that large asset class back to target.

Gauss Rebalancing Recommendations
Should VOO continue to remain significantly above target when the December review takes place, I will sell a few shares and use the cash to purchase any asset classes that are below target and signaling a Buy recommendation. Currently, only SHV is a Buy and I am only using it as a place to hold excess cash.
Since there are no purchase recommendations for asset classes other than SHV, I am not doing anything. The management model is to not sell any shares while using new cash and dividends to build up asset classes when a Buy shows up in the Risk Adjustment worksheet.
Gauss Performance Data
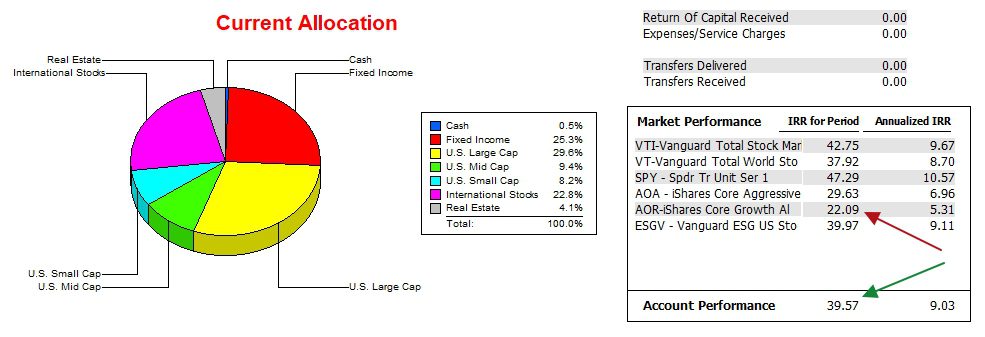
Since 12/31/2021 the Gauss has outperformed the AOR benchmark by a wide margin. Annualized, the Gauss is ~1.5 percentage points behind the S&P 500 (SPY).
Gauss Risk Ratios
Checking the Jensen Performance Index we see how well the Gauss was performing at the end of the Biden Administration. Since January the portfolio has not performed quite as well, although the Information Ratio is higher than it was 10 months ago. The same is true for the Sortino Ratio.
Once we clear November and December we will see the slope of the Jensen move closer to zero.

Questions and Comments are always welcome.
Discover more from ITA Wealth Management
Subscribe to get the latest posts sent to your email.
Leave a Comment or Question