
Blueberry Picker
Kepler recently experienced changes in the portfolio makeup. I moved the Kepler to Closed-End-Funds (CEFs) in an experiment to see how well this investing model might work going forward. The Kepler is one of the poorest performing portfolios so it made sense to make a change.
In this post I will explain how I go about rebalancing the portfolio when dividends and/or new cash arrives.
Kepler Security Holdings
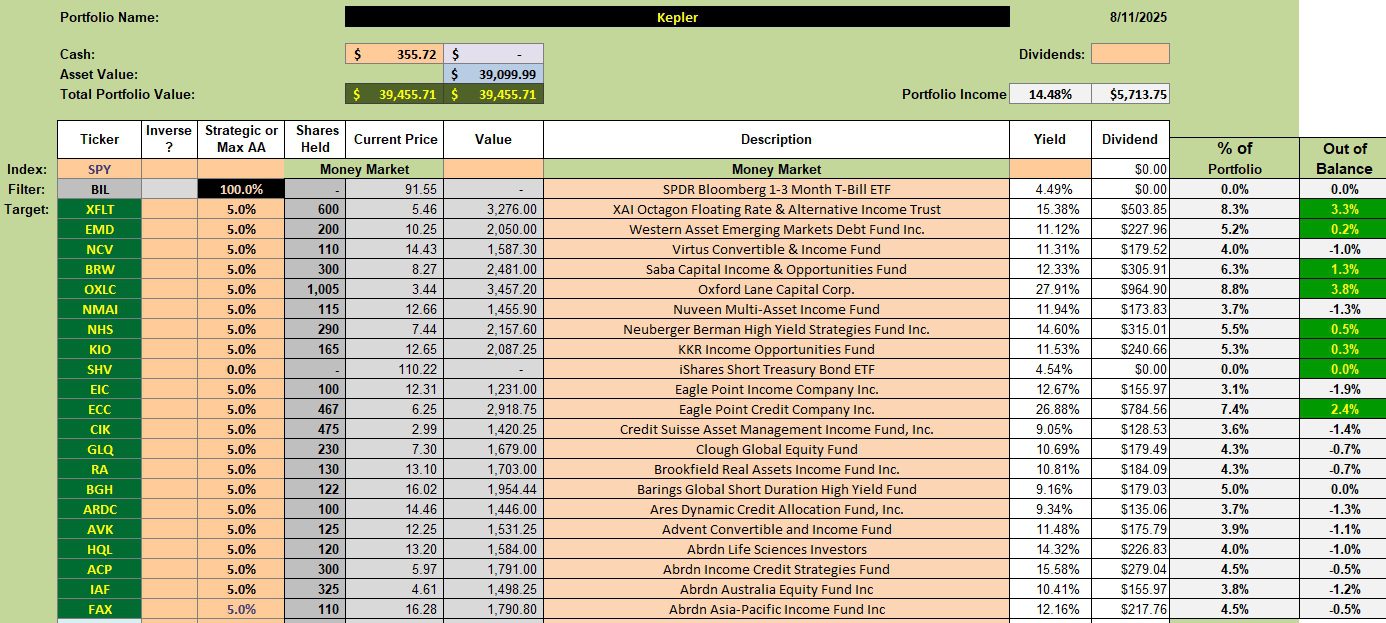
Below are the current 20 CEFs that make up the Kepler. The income is very high (nearly 14.5%) at this point and I don’t anticipate it will remain at this level. I’ll be satisfied with a return of 10.0%.
Kepler Rebalancing Recommendations
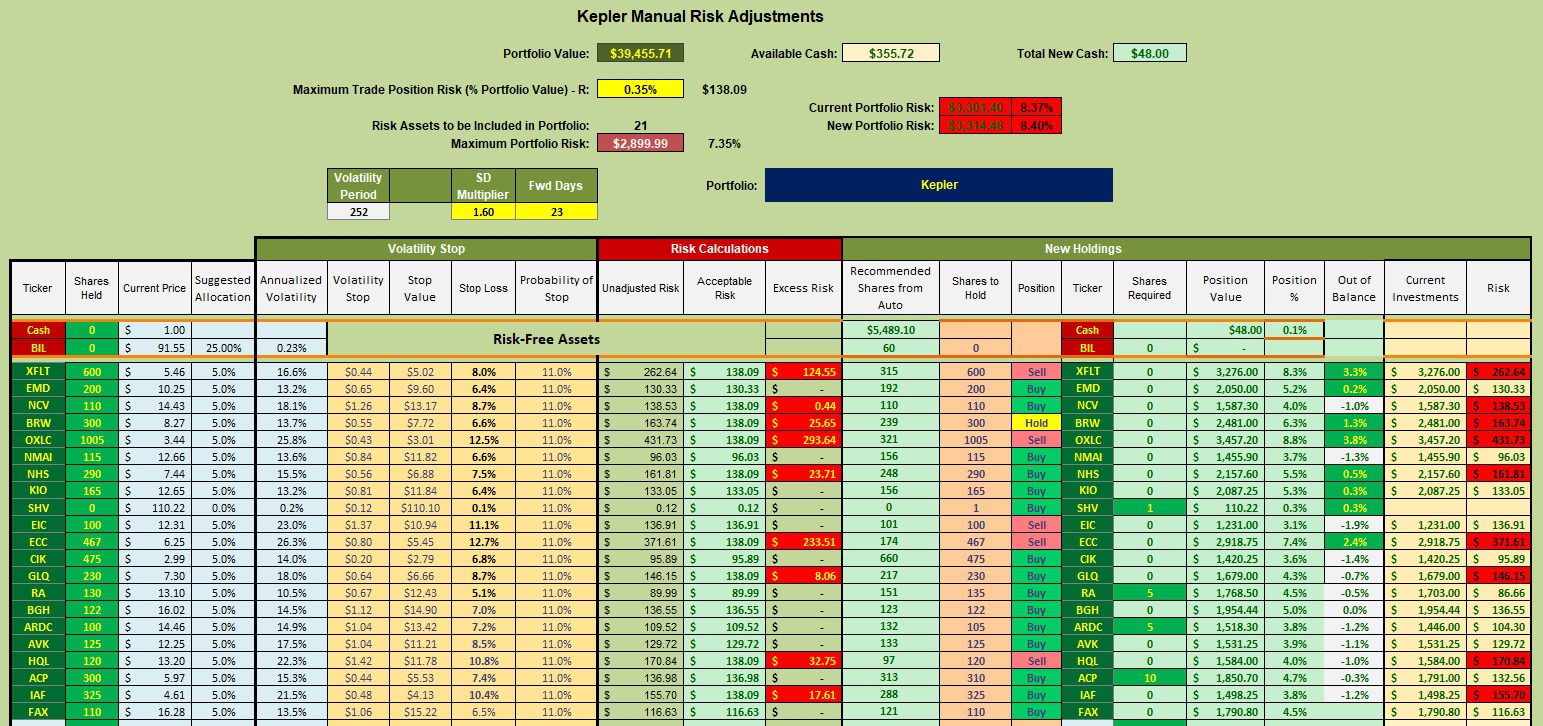
How am I rebalancing the portfolio? I first focus on the Buy recommendations. Sell and Hold recommendations are ignored.
- If the CEF is a Buy and the number of shares exceeds the recommended number, I move on to the next Buy CEF. EMD is an example as it holds 200 shares and the recommended number is 192. In this situation I do nothing with EMD.
- RA is an example where the recommendation is a Buy, but the security only holds 135 shares when 151 shares are recommended. If sufficient cash were available I would place a limit order for the difference. Since cash is limited I placed an order to purchase 5 shares. I set limit orders a few pennies below the current price. Limit orders set this close to the current price generally end up being struck.
Kepler Performance Data
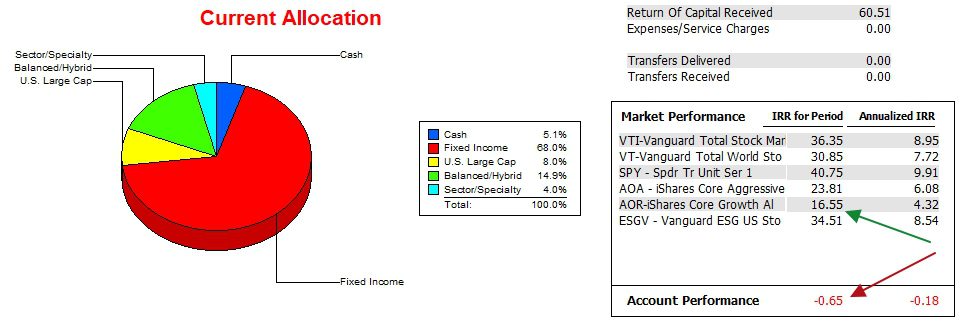
Since 12/31/2021 the Kepler is far behind all benchmarks. I would have been better off to follow Warren Buffett’s recommendation of doing nothing except buying the S&P 500 index. The Buffett recommendation is what I followed with the Copernicus and the results are so much better than what one sees for the Kepler.
Kepler Risk Ratios
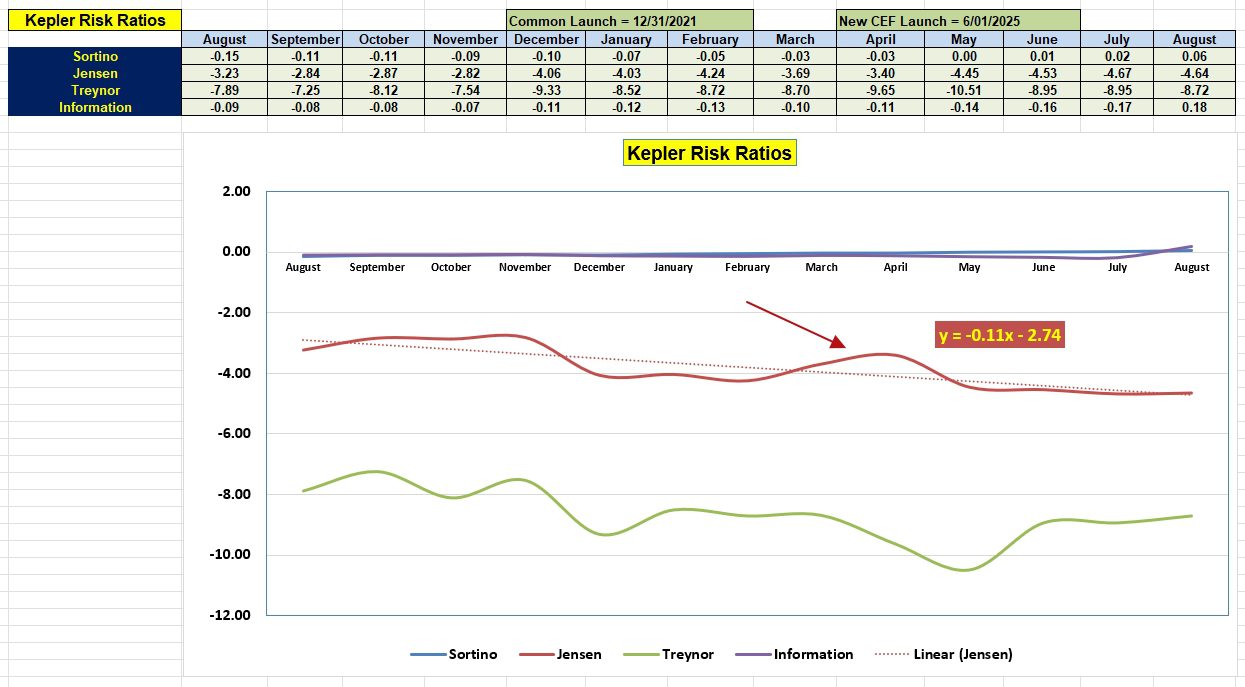
Over the past year the Jensen Alpha has been bouncing between -2.8 and -4.6. With the move to CEFs I will be watching to see if the Jensen begins to show positive growth.
Kepler CEF Performance Information
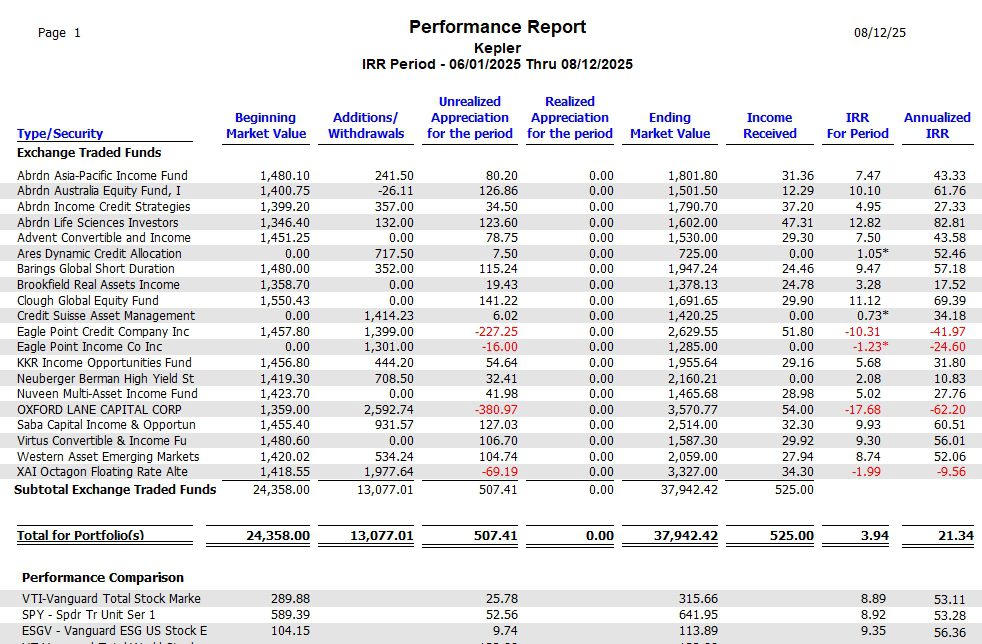
I’ve been using the CEF investing model for approximately 2.5 months with the Kepler. Over this short period the model is not showing promise as the Annualized Internal Rate of Return is only 21.3% while the S&P 500 (SPY) is more than double at 53.3%. Once more, it is extremely difficult to outperform the S&P 500 year after year.
Comments are always welcome.
Discover more from ITA Wealth Management
Subscribe to get the latest posts sent to your email.
Leave a Comment or Question