
Intentional Camera Movement (ICM)
Kepler is scheduled for a review later this month, but I moved it up as I am making a few changes. One change occurred this morning as I sold all shares of SHV (expense ratio of 15 basis points) and replaced it with shares of SCHO (expense ratio of 3 basis points) while increasing the interest rate a small amount. I am making this change in all the portfolios.
As with several other portfolios one needs to make a critical decision. Does one rebalance all asset classes at this time or does it make sense to hold cash in a short-term treasure (SCHO) and wait for a better buying opportunity? The wait could easily lengthen out to as much as two years. One never knows when the “worm” will turn. We have two critical measurements to use as historical market references and they are:
- Buffett Indicator: The Buffett Indicator is the ratio of the total United States stock market to GDP. The ratio is currently hovering around 230% and anything above 100% is “playing with fire.” We are well into the danger zone and this is one reason I am holding such a high percentage in short-term treasuries. The second critical broad measurement is the Shiller CAPE Ratio.
- Shiller CAPE Ratio: “This metric, developed by Nobel laureate Robert Shiller, measures market valuation using 10-year inflation-adjusted earnings, indicating that U.S. stocks are currently priced at top historical levels, comparable to the 2000 dot-com bubble.” We remember all too well what happened in late 1999 through 2002. The all-time high was December 1999 when the ratio hit 44.2. The current Shiller CAPE Ratio is a tad over 42. We are in “nose bleed” territory when it comes to the stock market.
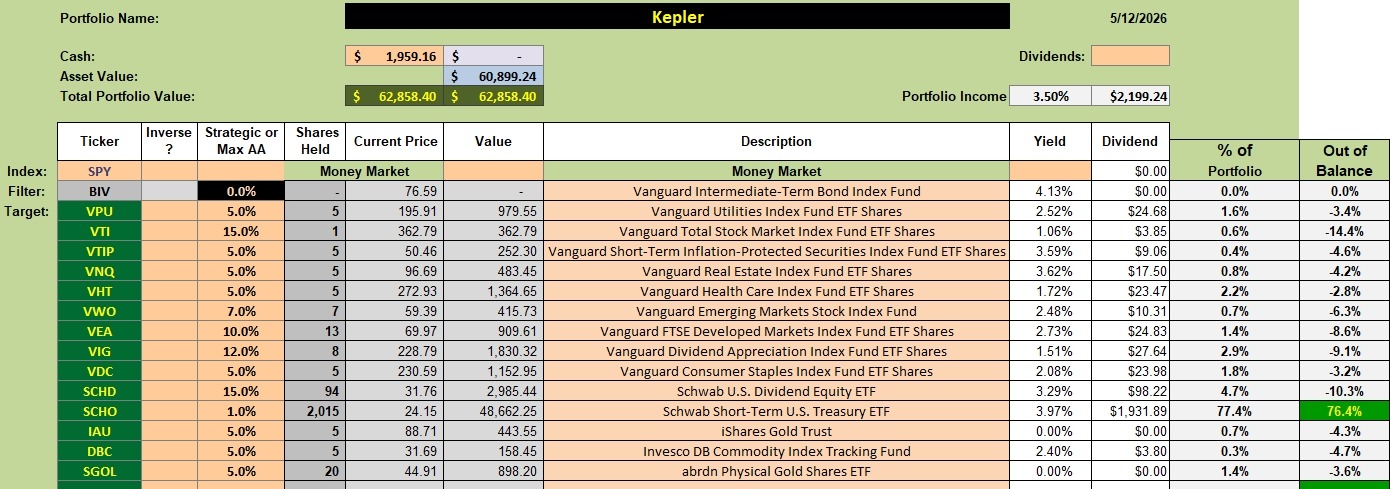
Kepler Security Holdings
Below are the current security holdings for the Kepler. The portfolio is definitely skewed toward cash in the form of short-term treasuries (SCHO).
The long-term goal is for the owner to continue to add cash to the portfolio – if possible and to use the cash to either purchase more shares of SCHO or nibble at a few asset classes by placing limit orders 5% to 10% below the current price. This is a waiting game – at best.
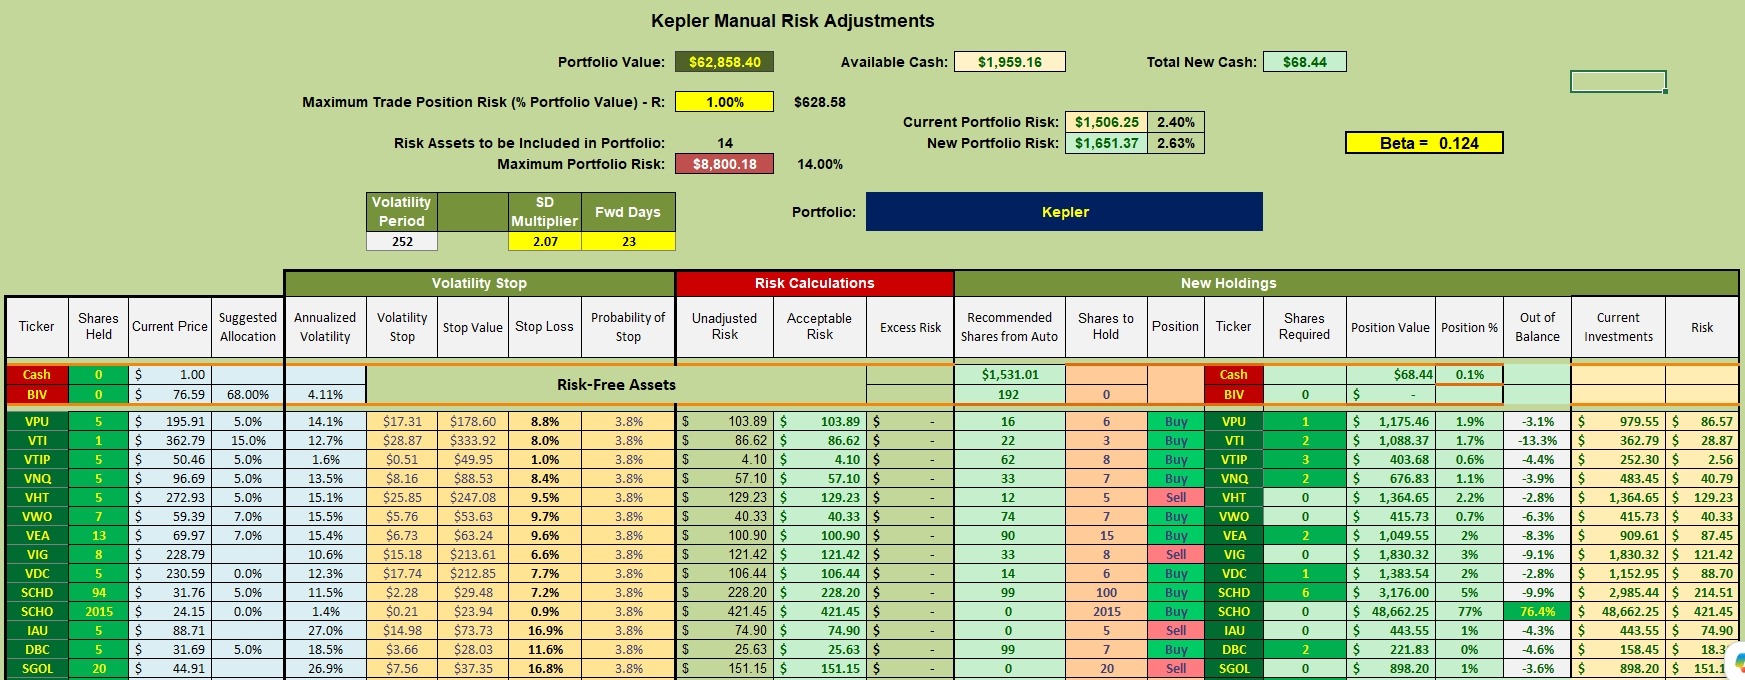
Kepler Rebalancing Recommendations
I have a few limit orders in place, but most of the portfolio will reside in SCHO until there is some sort of correction. Not only is the market overbought, but earnings from AI investments are falling short of the huge build out of data facilities. Many communities don’t want these facilities as they are heavy users of electricity and water and employ too few workers.
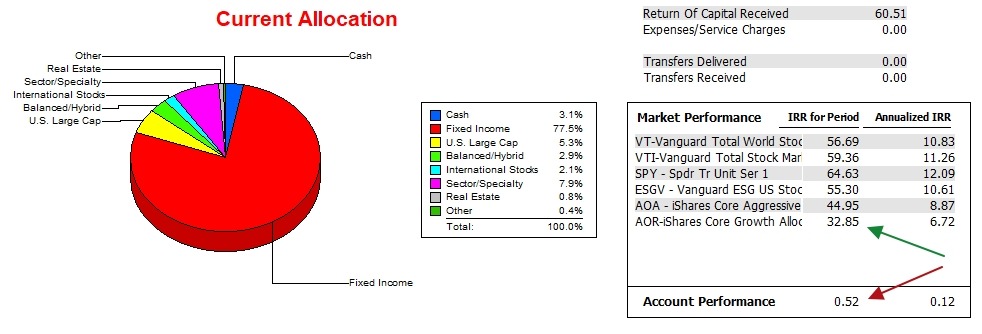
Kepler Performance Data
Since 12/31/2026 performance of the Kepler has been abysmal. Withdrawals at critical times hurt performance. The same thing happened to the Einstein portfolio. The delta gap between the Kepler and the AOR benchmark will close if there is a huge correction. Should the market continue to move up the gap will widen. The Fixed Income or red section of the pie chart represents SCHO.
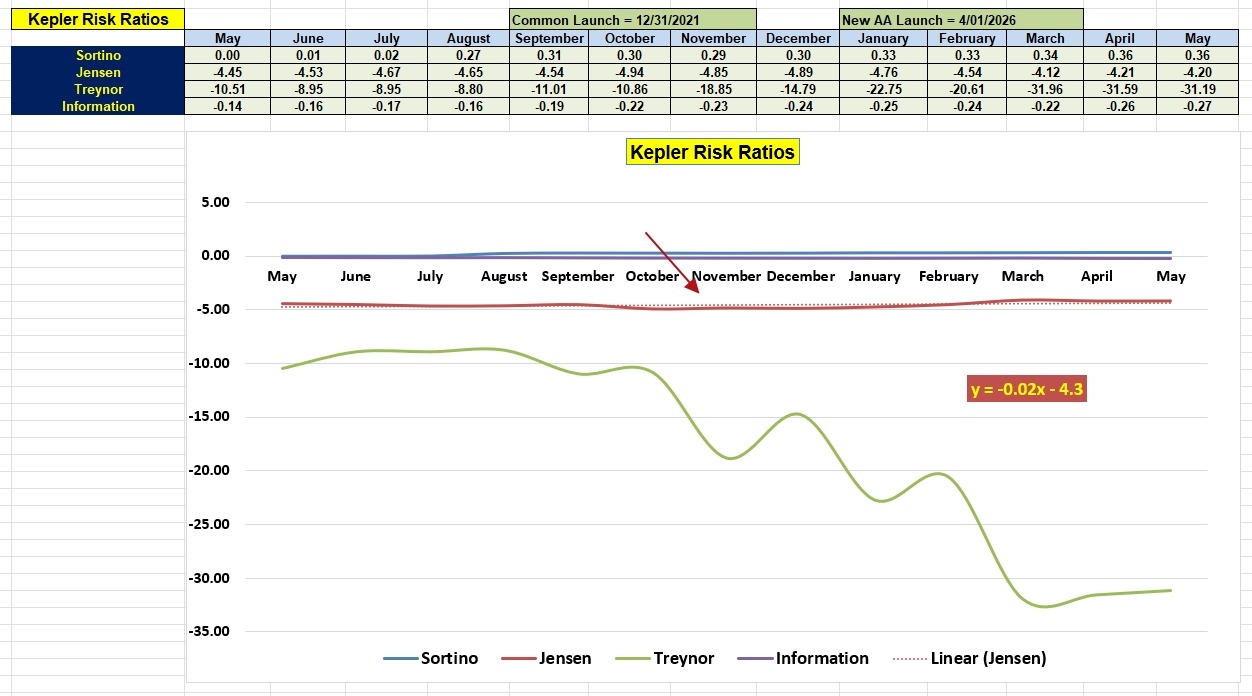
Kepler Risk Ratios
Based on the Sortino Ratio the portfolio is increasing in value. However, the Information Ratio tells us the portfolio is not keep pace with the benchmark. Since the current asset allocation is set up to be extremely conservative, the Jensen Alpha is better off (slightly) than it was in May of 2025.
Kepler Asset Allocation Portfolio Review: 30 April 2026
Kepler Portfolio Update: 19 December 2025
These links show where the Kepler was a few months back.
Discover more from ITA Wealth Management
Subscribe to get the latest posts sent to your email.
Leave a Comment or Question