
Spiral staircase with no external support.
McClintock is one of three Sector BPI portfolio tracked here on the ITA blog. Based on the latest Bullish Percent Indicator data there are no new recommendations. None of the sectors held in the McClintock are overbought and there are no oversold sectors. Therefore we will continue to hold Materials, Energy, and Real Estate. After the market closes on Friday I’ll take another look at the BPI data to see if there are any changes.
I am seriously considering making one change to the Sector BPI investing model and that is to add SHV to the list of possible ETFs. As the sector portfolios come up for review, look for this potential change.
McClintock Sector BPI Portfolio
Below are the current ETF holdings for the McClintock. To use up the excess cash, limit orders are in place to purchase a few shares of both VTI and VOO.
We patiently wait for any or all of the three sectors to reach the overbought mark (70% bullish or higher) before placing a 3% TSLO under the overbought sector. VNQ, for example, is the ETF used to represent the Real Estate sector. No action is recommended this month.

McClintock Performance Data
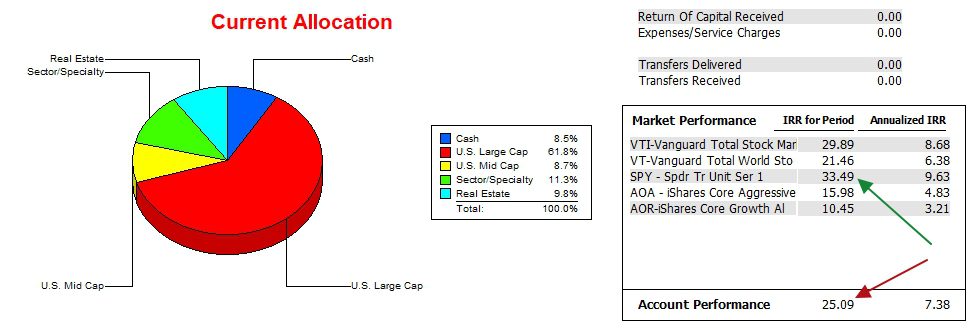
Since 12/31/2021 the McClintock has generated a nice return, but continues to trail the S&P 500 ETF, SPY. The same would be true for VOO. The portfolio is outperforming both AOA and AOR, two other potential benchmarks.
This data comes from the commercial software program, Investment Account Manager. I highly recommend this software for serious investors. Let me know if you need more information.
McClintock Risk Ratios
Over the past year an increase in the risk-free interest rate placed downward pressure on the Jensen Alpha. That does not account for the overall decline in the Jensen, but it did have an impact. I held too much cash in the portfolio and this was a drag as the market moved up.

Disclaimer: The ITA blog is not set up to give financial advice. Rather, it is a site where readers can observe how different portfolios are managed using various investment models. Some models are quite sophisticated while others are very simple. Over the past years it is the simple ones that have generated the best Return/Risk ratios.
Discover more from ITA Wealth Management
Subscribe to get the latest posts sent to your email.
You must be logged in to post a comment.