
Grandma & Granddaughter
Pauling is another asset allocation portfolio set up to provide some resistance should we experience a correction or worse, a recession. The portfolio is slowly rounding into shape where most of the asset classes are close to their target percentages.
The goal is to reinvest new cash deposits and dividends. Assets most under target will be the focus when cash becomes available.
Pauling Asset Allocation Model
Below is the asset allocation model for the Pauling portfolio. As structured, the Pauling is unlikely to keep pace with the S&P 500 as the portfolio includes a number of income generating assets. These securities have a low volatility and will not perform as well in a strong bull market. However, should the stock market cool down, these income generators should hold up better in a poor equity environment.
With the coming appointment of a new FED Chairman, expect interest rates to be cut which will likely result in higher inflation. Australia is going the opposite direction as they increased interest rates in order to cool their economy while keeping inflation in check.
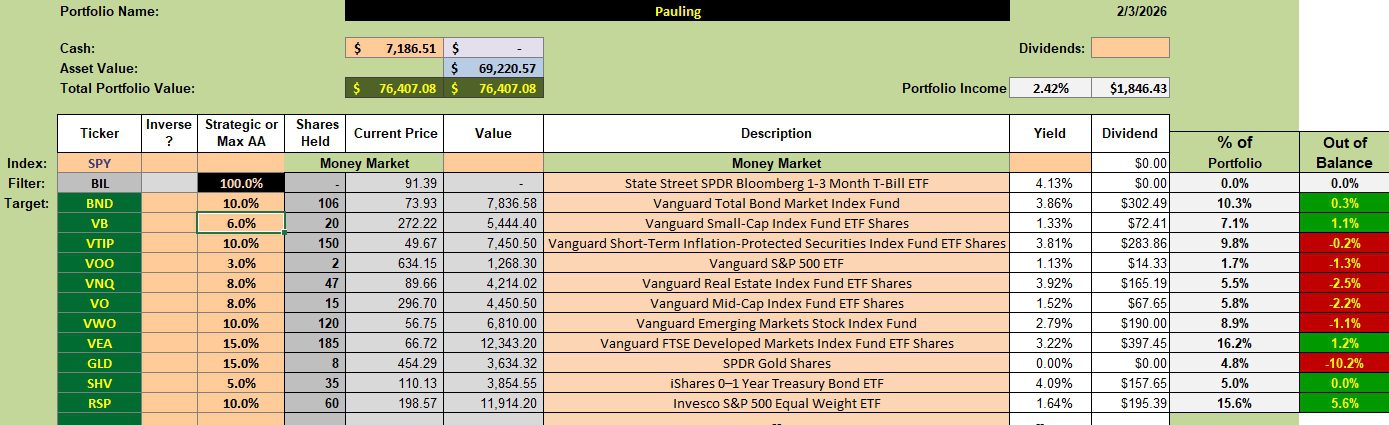
Pauling Rebalancing Recommendations
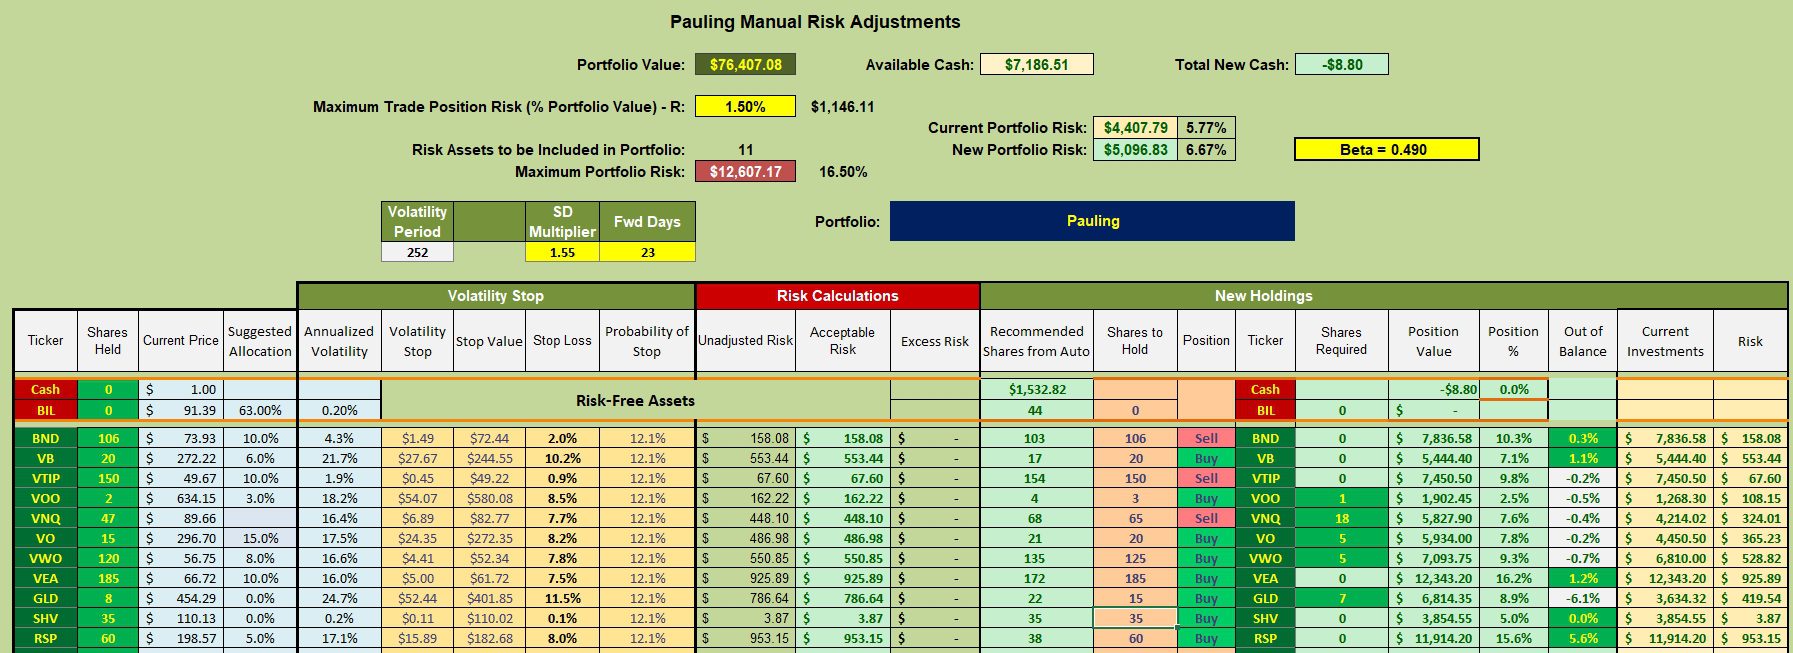
Limit orders are in place to pick up shares for those assets most below target. In addition, I have Trailing Stop Loss Orders (TSLOs) set for RSP, VO, VOO, and VB as there is a high probability equity ETFs will experience a draw-down sometime in 2026. The TSLOs were set around 10% so it will require a correction to trigger the stop loss orders.
Pauling Performance Data
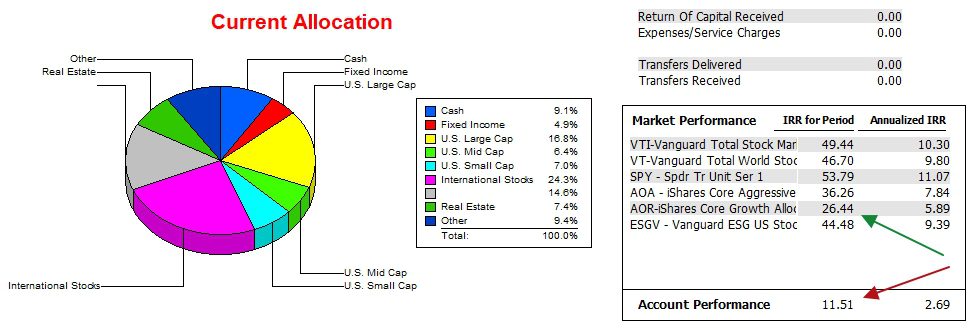
Since 12/31/2021 the Pauling has not kept pace with the AOR benchmark.
Once more, the IAM software is not identifying all the ETFs. BND is 10.3% of the portfolio and the pie chart indicates only 4.9% is Fixed Income. I checked on the suspected missing assets and the software seems to be coded properly. Obviously, there is an error somewhere in the software or I don’t have something set up correctly.
Pauling Risk Ratios
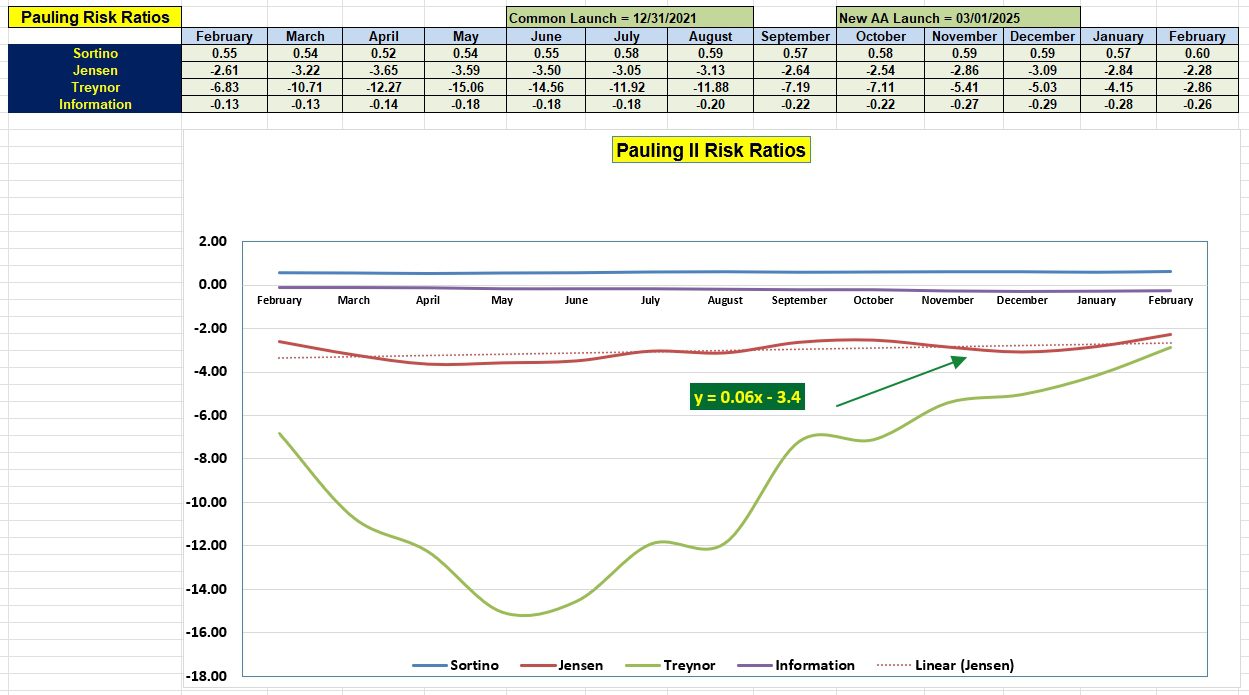
When a portfolio is not matching or exceeding its benchmark I resort to the risk ratios to see what current trends might be telling us. In nearly every case, the Pauling made positive strides this past year. With a value of -2.28 for the Jensen Alpha, this metric is the strongest it has been all year.
A positive slope for the Jensen is another encouraging signal the portfolio is showing improvement.
Comments are always welcome.
Discover more from ITA Wealth Management
Subscribe to get the latest posts sent to your email.
Leave a Comment or Question