
Mount Whitney left of center.
Like the Carson, which I reviewed yesterday, the Franklin is one of six Sector BPI Plus portfolios. This investing model is rather new and unique to the ITA Wealth Management site. At least I’ve not found anything quite like it on the Internet. Several links are provided at the bottom of this post to help interested readers learn how to manage a Sector BPI portfolio. Each week I post Bullish Percent Indicator data and based on that information we look for sectors of the U.S. Equities market that are oversold (Buy opportunity) or overbought (Sell opportunity). This is a contrary investing model and that is not new to the investing world.
There is a weakness in the Sector BPI model and it is related to periods when sectors reach the overbought zone and are sold when the ETF retreats 3%. Should the sector move back up into the overbought zone after being sold the investor is caught holding cash as the market moves higher. To patch this weakness in the Sector BPI model we revert to a modified version of the Dual Momentum™ model. Rather than sitting on cash as the market moves higher, we use the Kipling spreadsheet to guide us into equity ETFs such as VTI, SPY, VOO, ESGV, VEA, or VWO. These tickers are U.S. Equity, Developed International Equities, and Emerging Market Equities.
Follow explanations such as the Carson for details on how to manage a Sector BPI Plus portfolio. Today’s review is such an example. New ITA readers may fund this review or update of interest. If you have questions, post them in the Comment section provided with each blog post.
Franklin Investment Quiver and Holdings
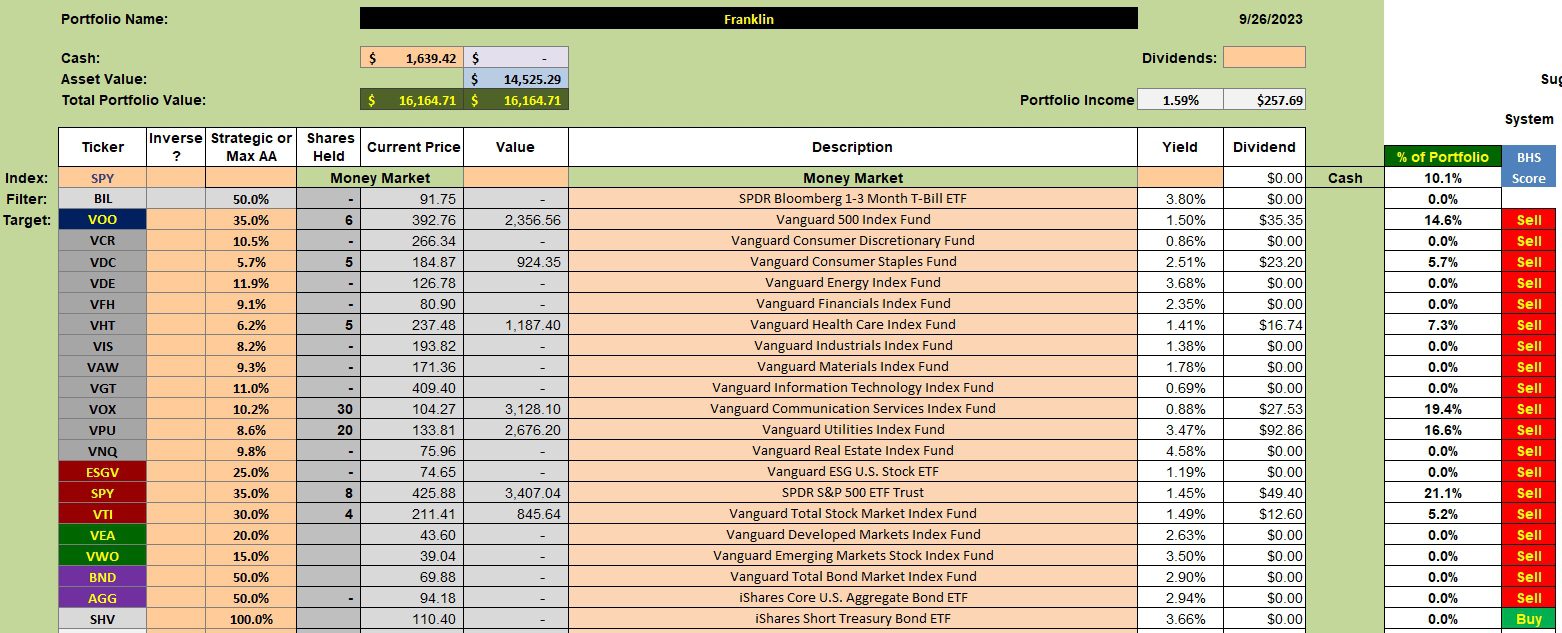
Below is the investment quiver and holdings for the Franklin portfolio. The sector ETFs are those with the dark gray background or ETFs VCR down through VNQ. As ITA readers will recall from last Saturday’s data, VCR, VDC, and VHT are three sectors currently oversold. The Franklin is holding five (5) shares of VDC or 5.7% of the portfolio. The recommended percentage is 5.7% so we are right on target. The Franklin holds 5 shares of VHT or 7.3% of the portfolio. The recommended percentage is 6.2% or close enough. I tend to round the holdings to the nearest five shares. This rounding process is easier with larger portfolios. I will deal with VCR in a moment as the Franklin is holding zero shares. Note that the recommended percentage (third column from the left) is 10.5%. These percentages are based on three-year volatility averages. The sum of the percentages associated with the eleven sector ETFs adds up to close to 100%.
Franklin Security Recommendations
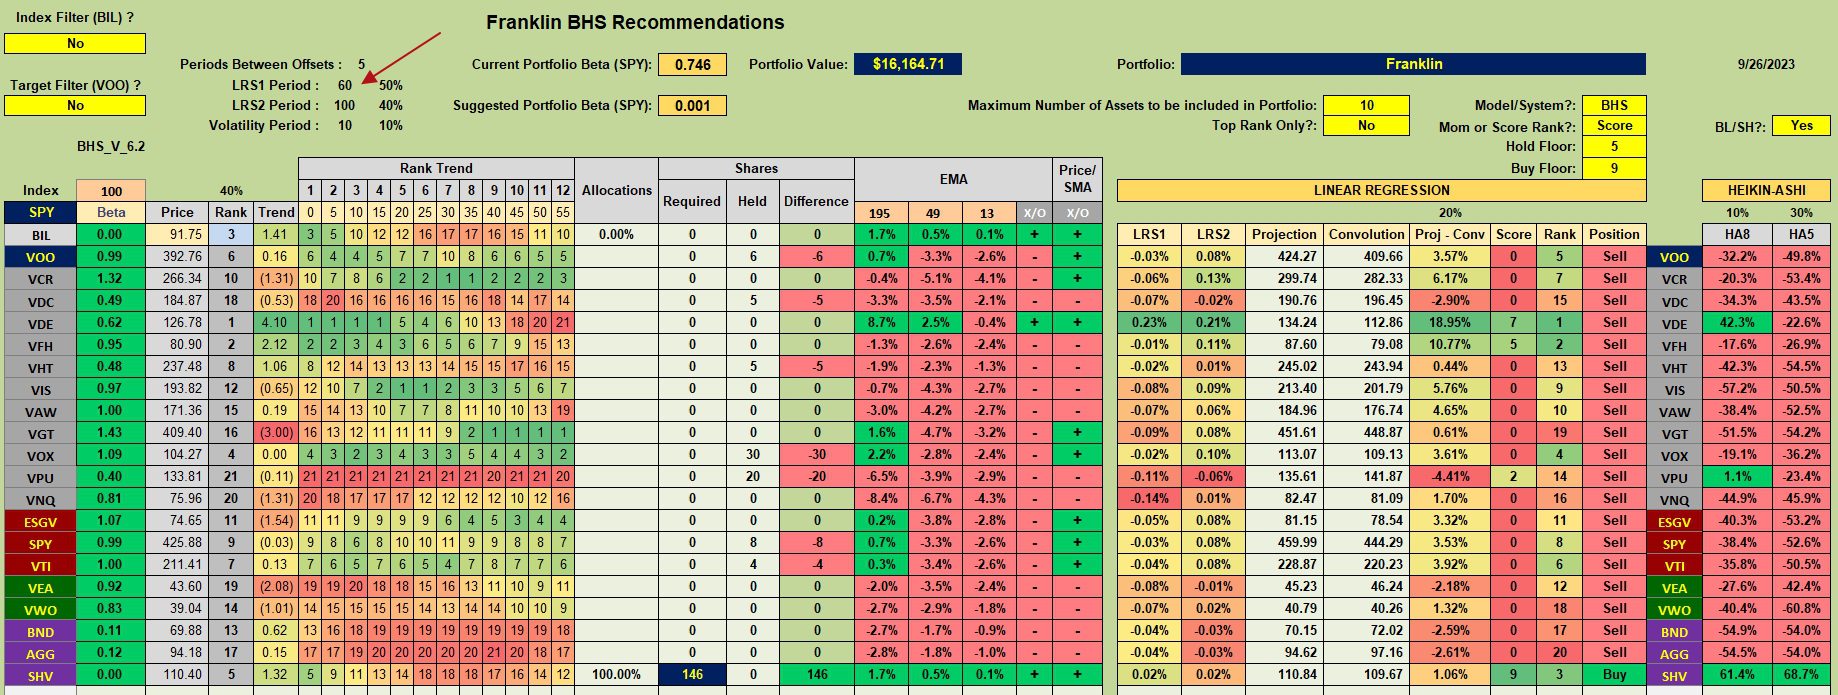
The following worksheet from the Kipling spreadsheet is not recommending any equity ETFs for purchase so I will concentrate strictly on the sector ETFs. Regardless, the first order of business is to populate the portfolio with sector ETFs should they be recommended.
Franklin Manual Risk Adjustments
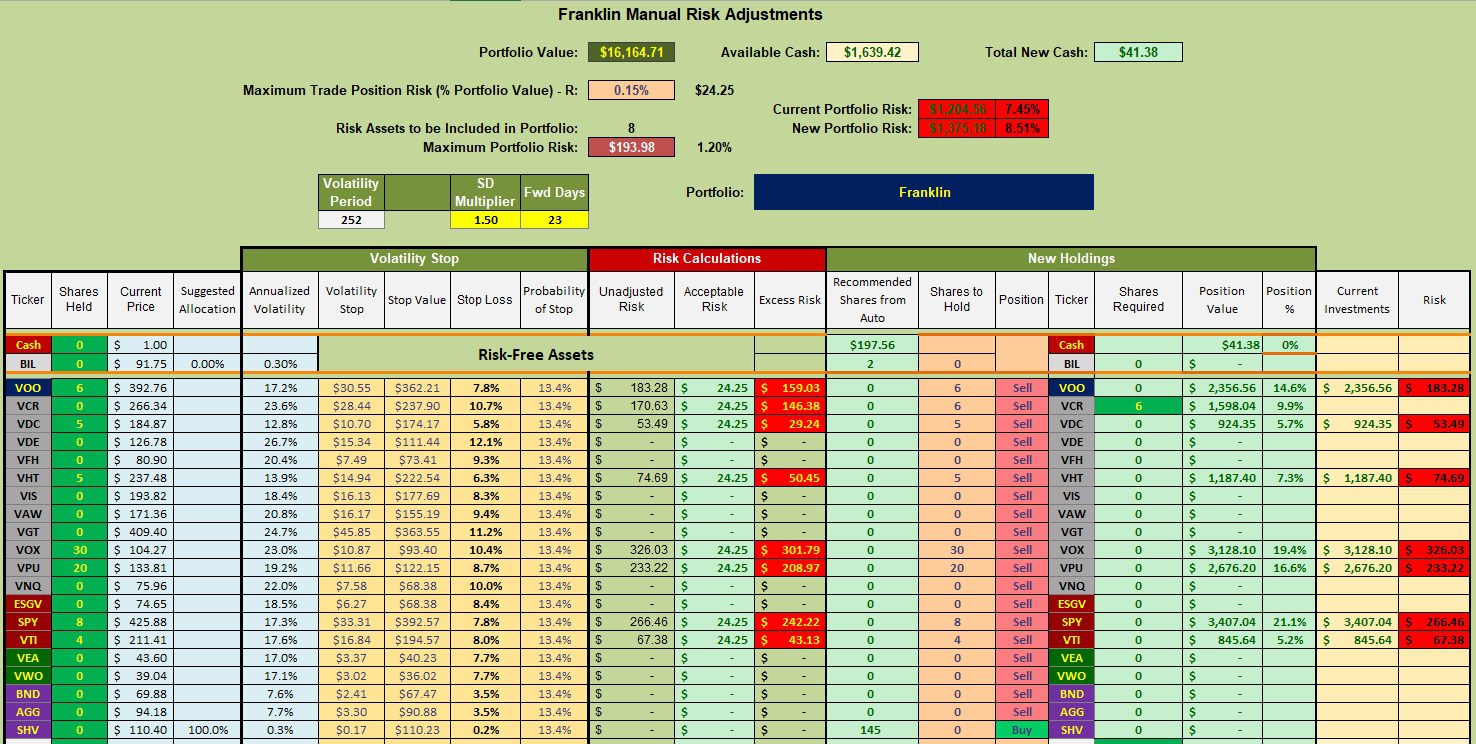
The Manual Risk Adjustment worksheet is also part of the Kipling spreadsheet. While cash is limited there is enough money available to purchase six (6) shares of VCR. This will bring VCR up to 9.9% of the total portfolio or very close to the recommended 10.5%.
I placed a limit order to purchase six (6) shares of VCR at $267.00.
Franklin Performance Data
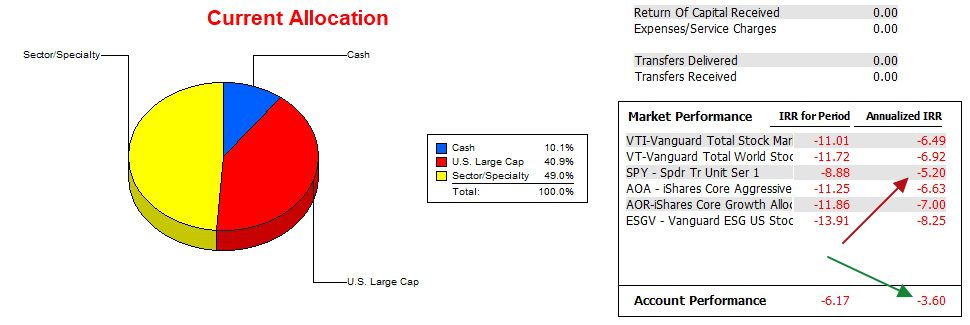
As I recall the Franklin was one of the last Sector BPI portfolios to be launched near the beginning of 2022. Readers will recall that 2022 was a poor year for U.S. Equities. Over the past 21 months the Franklin outperformed SPY or the S&P 500 ETF by 1.6 percentage points annualized. See the red and green arrows.
Franklin Risk Ratios
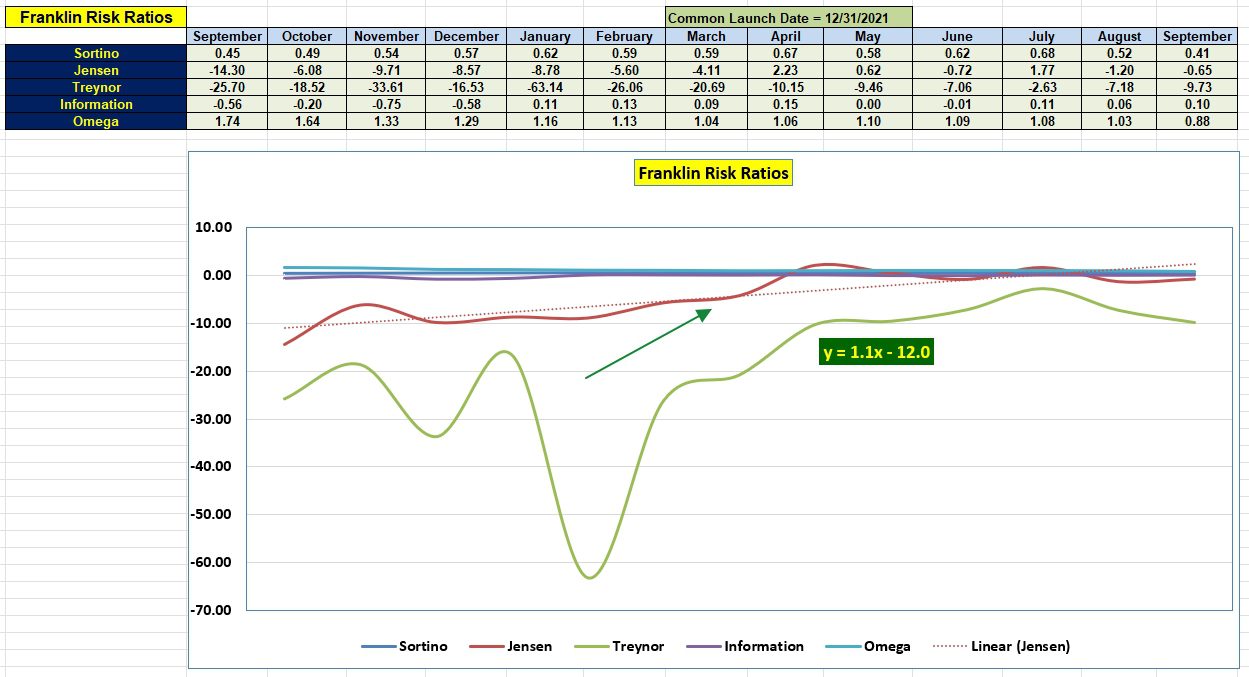
ITA readers will not find the following data on other investment websites. These five risk measurements, tied to the different ITA portfolios, are designed to help investors dig into the risk associated with each portfolio. If I were to rank the factors as to their importance the ranking would look like this. 1. By far the most important is the Jensen Alpha or Jensen Performance Index. 2. Information Ratio as it lays out the portfolio performance compared to its benchmark. 3. Sortino Ratio. I much prefer the Sortino Ratio to the more popular Sharpe Ratio. “The Sharpe ratio determines the returns based on the total volatility in the market, which includes upside and downside risks. On the other hand, the Sortino ratio only considers the downside risks for assessing additional returns. As the downside risk is a major concern for investors, they prefer Sortino ratios.” 4. Treynor Ratio. This ratio is too dependent on the beta of the portfolio. 5. Omega is quite similar to the Sortino Ratio.
In addition to the Jensen Alpha, pay attention to the slope of the Jensen. The goal is to maintain a positive slope and 1.1 is an excellent value. It is very difficult to hold on to a positive value when the equities market is in decline.
For the benefit of new ITA Platinum members, below are additional blogs on the Sector BPI investing model.
Buying Guidelines For BPI Model Portfolios: 9 December 2022
Tweaking Sector BPI Plus Model: 20 May 2023
Franklin Portfolio Review: 21 July 2023
Gauss Portfolio Update: 19 March 2023
Discover more from ITA Wealth Management
Subscribe to get the latest posts sent to your email.
You must be logged in to post a comment.