
Lake District, North-West England
It was another bullish week in the US Equity markets with the SPX (S&P 500 Index) again making new highs:
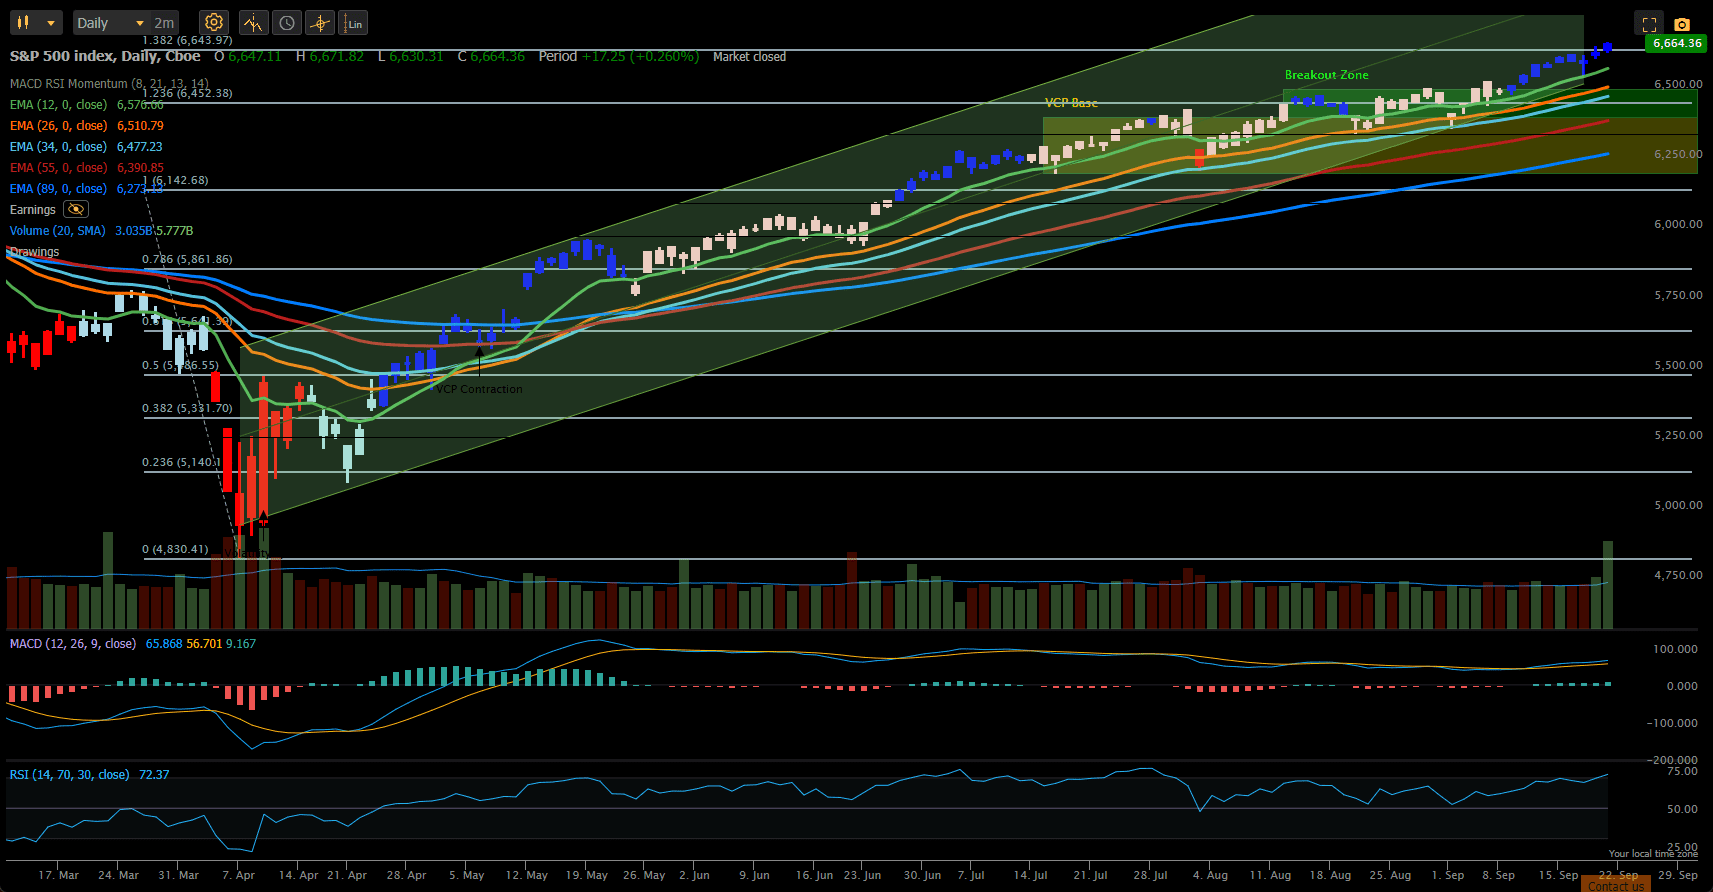 We have broken through the 6450 resistance zone and are now sitting at the ~6650 level. There is still no evidence of the historical September weakness in the US equity markets as we continue to grind higher.
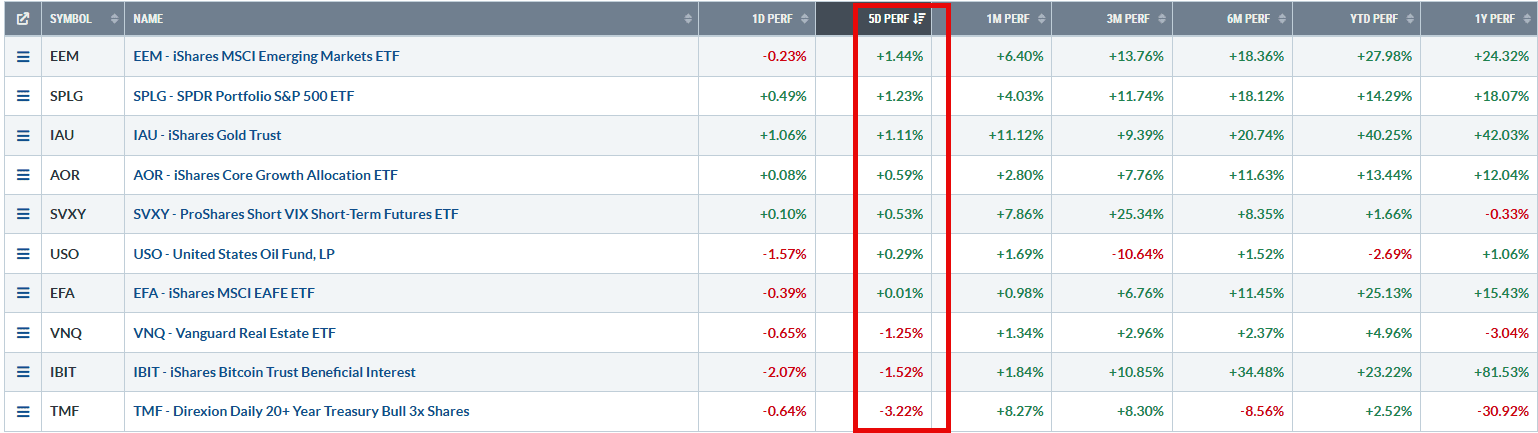
In terms of performance relative to other major asset classes US equities were only outperformed by Emerging Market equities with Bonds falling back following the anticipated reduction in interest rates that had already been priced in:
 In the Rutherford-Darwin Portfolio I let my Options in EFA and EEM expire so as to keep the premium received when I sold the Options. EFA expired Out-of-The-Money (OTM), so I am still holding 300 shares, but EEM closed In-The-Money (ITM) and 200 shares of EEM were taken from me leaving me with 200 shares:
 The portfolio is showing an 8.77% Internal Rate Of Return (IRR) since inception (4 months ago) with 4.5% volatility. While this is a very attractive risk-adjusted return (1.9x Sharpe Ratio) the portfolio has missed out on significant return opportunities through being under-invested (~50%) and over-hedged compared to the 100% invested benchmark AOA Fund:
 Although it makes me a little nervous at this point, I think that I need to be a little more aggressive going forward.
Checking on the recommendations of the original BHS model from the Kipling workbook:
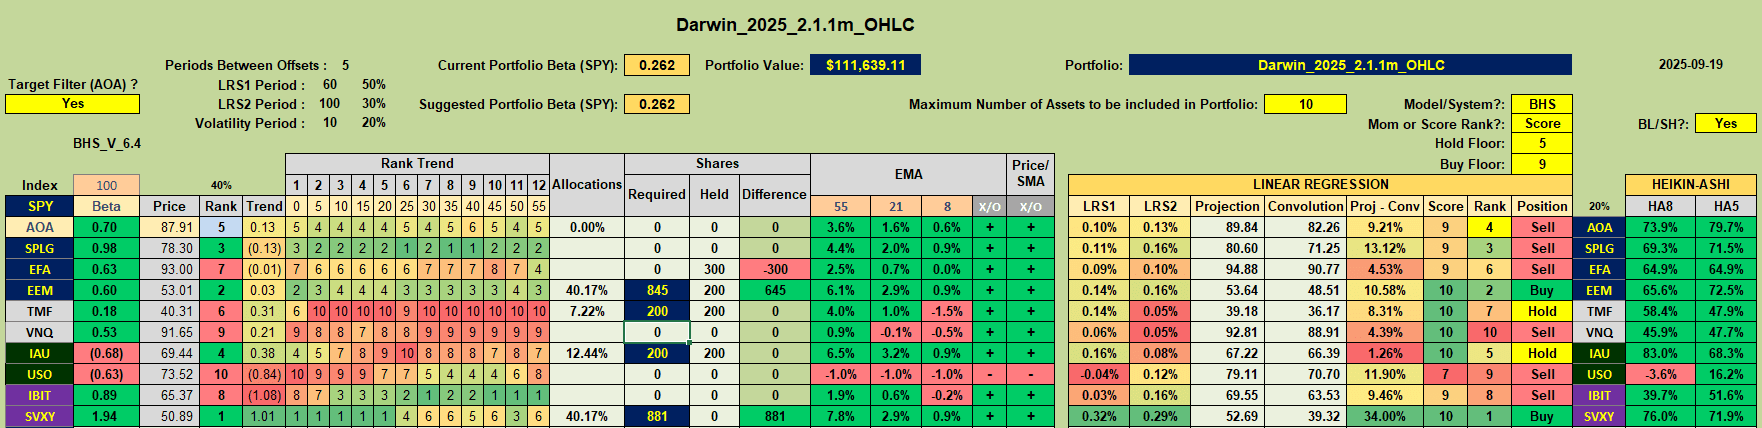 and ignoring SVXY (Inverse Volatility ETF), we see a Buy recommendation for EEM (Emerging Markets) and Hold recommendations for IAU (Gold) and TMF (Bonds).
Moving to the newer rotation model discussed last week:
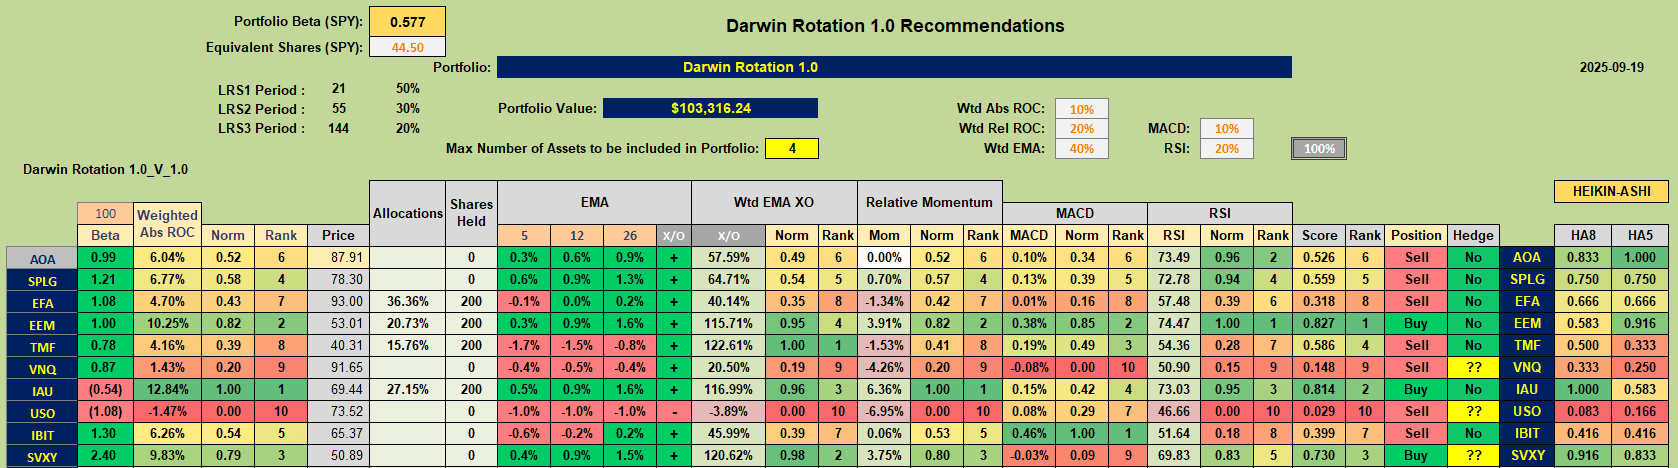 this changes slightly, dropping TMF from the Buy/Hold recommendations and just leaving EEM and IAU as Buy candidates.
I have done a little back-testing on this new system and it seems that it might be a little too fast/sensitive, resulting in too much trading, so I have started to see if I can slow it down a little while still retaining a low level of risk. At this point I have focused on the EMA “Trend” signals and have increased the lengths of the look-back periods to range from 12 to 89 periods:

After weighting the cross-over strengths and using a Wilder’s smoothing signal line to generate Buy/Sell signals:

we see something like the chart shown in the above screenshot for EEM – where we got a Buy signal on 5 September. with the weighted EMA line crossing above the signsl line.
 Ideally, I would like to see these “trends” last for at least ~20 days (1 month) with acceptable pullbacks. Even after the adjusted longer look-back periods this may not be sufficient to achieve this – but, of course, the market will do whatever it wants to do and all we can do is to try to manage the risk. Note, in the above screenshot, how the 34-period EMA (red line) seems to act as strong support – this might be built into the algorithm as a possible exit signal in the future.
Using these new calculations, current suggested Buy/Hold/Sell recommendations look like this:
 similar to the earlier recommendations but with SPLG added to the Buy List.
Based on the above, I will likely sell my current positions in EFA and TMF, add back the shares of EEM that were taken away and open a new position in SPLG.
For the allocations I will use the following calculations as a guide to increase allocation levels a little:
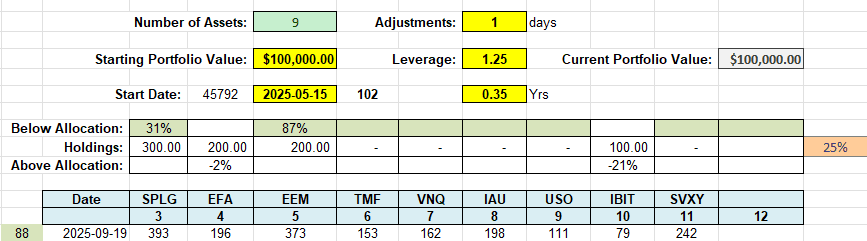
i.e I will likely end up holding 400 shares of SPLG, 375 shares of EEM and 200 shares of IAU.
Discover more from ITA Wealth Management
Subscribe to get the latest posts sent to your email.
Leave a Comment or Question