
Manzanar Memorial
Pauling is the Asset Allocation portfolio up for review this morning. As one of the poorest performing ITA portfolios over the past two years I made some changes. The big one is a move to an Asset Allocation model which will reduce my workload. Now that treasuries, bonds, real estate and international equities play a larger role, I am also adjusting the benchmark. Instead of using SPY as the benchmark I will be using AOR. More on this later.
The goal of these Asset Allocation portfolios is to keep the asset classes in balance. In balance is defined as + or – 0.5% of the Maximum AA percentage.
Portfolios up for review next week are: Bethe, Millikan, and Bohr. Bethe and Bohr are Asset Allocation portfolios while the Millikan uses the Sector BPI investing approach.
Investors interested in the Asset Allocation approach to investing, but want a simpler portfolio, check out the Swensen Six.
Pauling Asset Allocation Portfolio
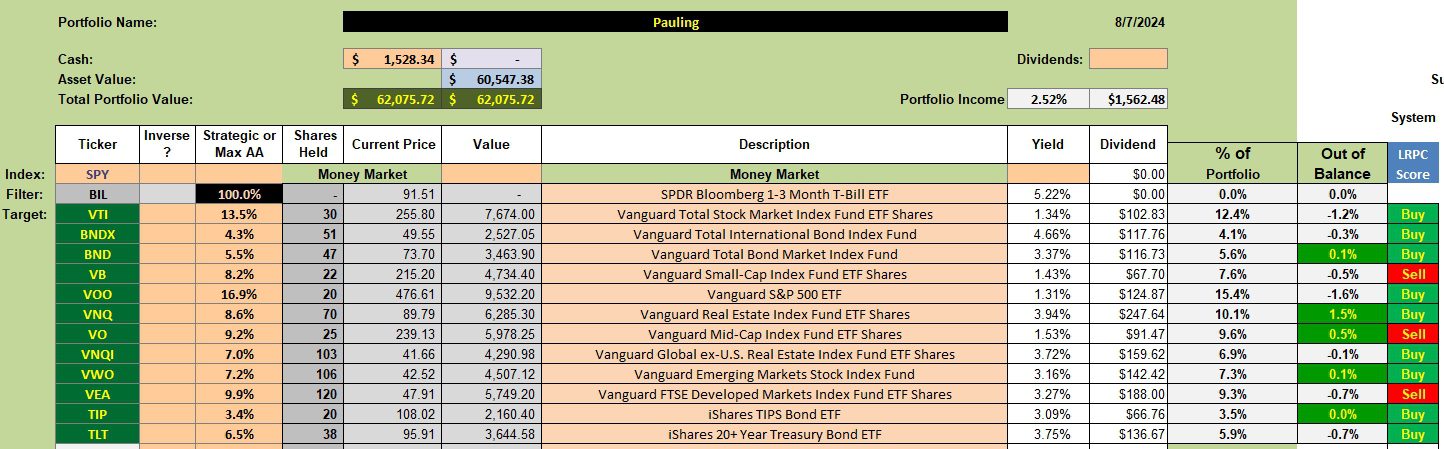
Below is the investment quiver and current holdings for the Pauling portfolio. ETFs out of balance on the low end are: VTI, VB, VOO, VEA, and TLT. With limited cash available, where does one focus attention or invest the available cash.
Instead of looking for ETFs that show up as a Buy, I focus on those ETFs registering a Sell as they are performing poorly and will eventually return to the mean. Using this logic the first ETFs to fill are VEA and VB. Note that VNQ is out of balance on the upside. Instead of selling shares of VNQ to raise cash we let this real estate ETF ride as we choose not to sell unless there is an emergency. By not selling these Asset Allocation portfolios are not a tax liability.
Pauling Manual Risk Adjustments
The following worksheet comes out of the Kipling spreadsheet and we use it as a guide as to which ETFs to purchase in order to bring more asset classes into balance.
Limit orders are set to add shares of VB, VOO, VEA, and TLT.
Overall, the Pauling is very close to being in balance. Fresh cash and dividends are used to bring assets out of balance into balance.

Pauling Performance Data
Since 12/31/2021 the Pauling lags the AOR benchmark by approximately 1.5% points. The green arrow points to the wrong benchmark. I will correct this in the next review.
In the recent draw-down the Pauling lost a smaller percentage due to diversifying into real estate, bonds and treasuries.

Pauling Risk Ratios
With the new Asset Allocation investing model now in place, the following table becomes more and more important as the months pass as we can focus on trends. Pay most attention to the Jensen Alpha and Information Ratio. The slope of the Jensen is another useful measurement as this will provide a significant clue as to the viability of the Asset Allocation model.

Drop your comments in the Comment section provided with each blog post. Share this blog site with friends and family.
Returning To Investing Roots: 5 August 2024
Pauling II Update: 1 April 2024
Discover more from ITA Wealth Management
Subscribe to get the latest posts sent to your email.
You must be logged in to post a comment.