
Traditional Santana House in Madeira – Island belonging to Portugal
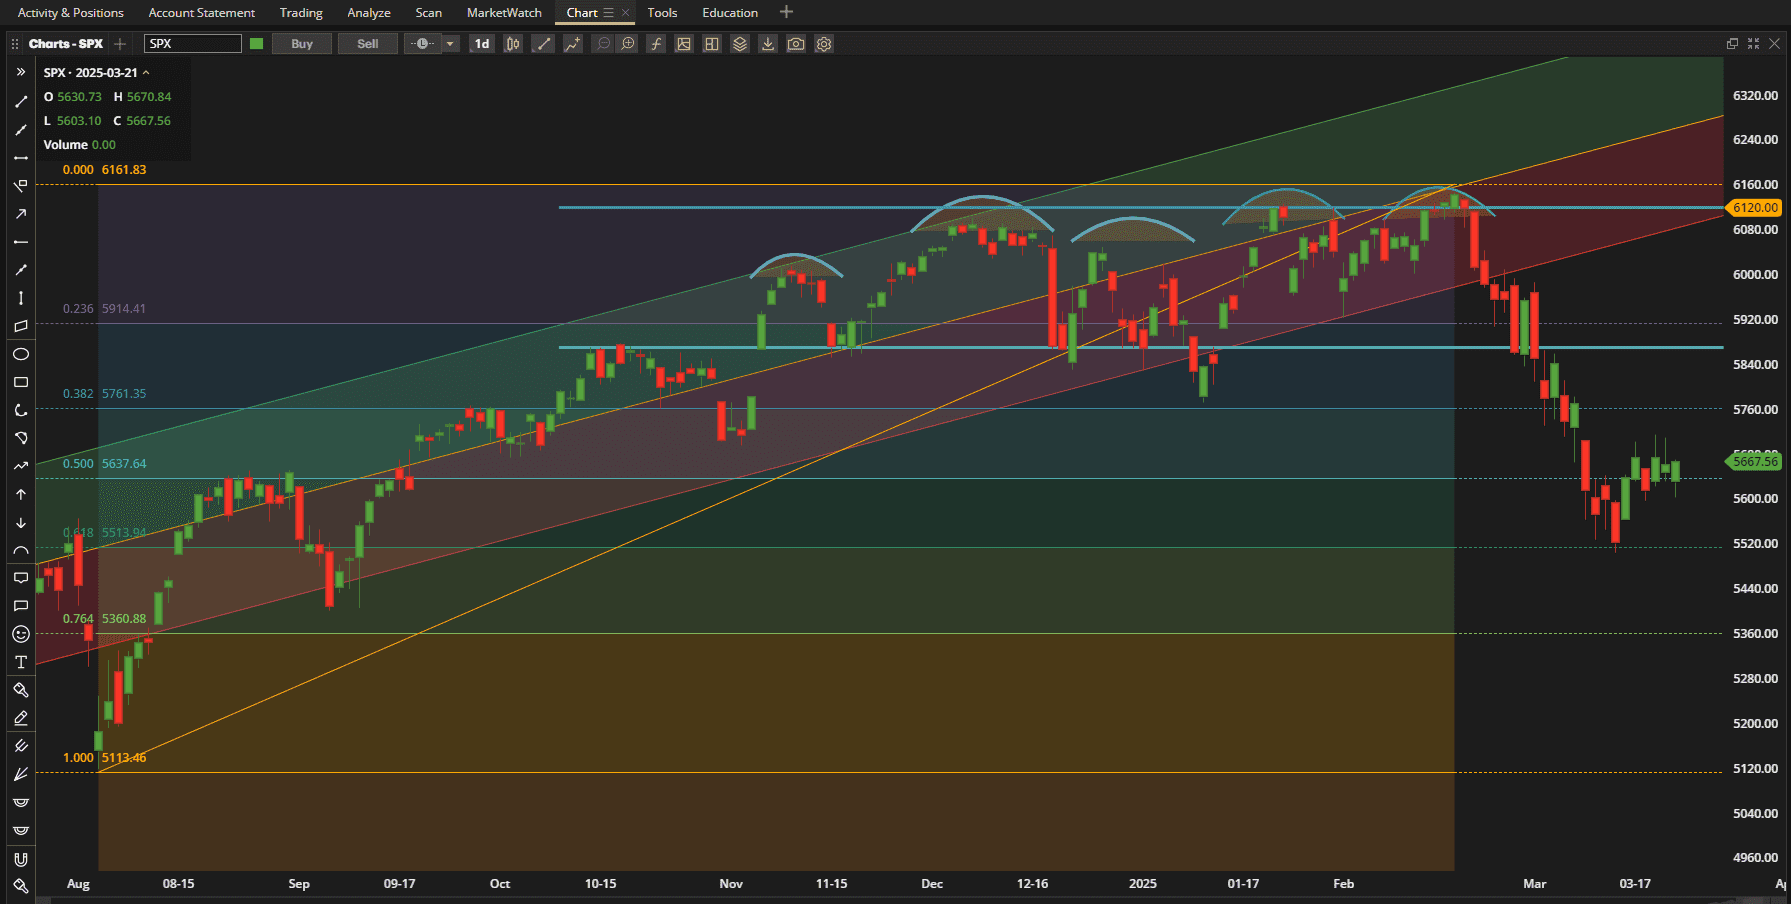
It was a week of sideways consolidation in US equity markets with the SPX (S&P 500 Index) closing slightly (~0.5%) higher than last week’s close after a small bounce off support at 5520. However, volume was average so there is no evidence of strong institutional buying or selling – maybe we will see a little more action towards the end of next week as the month (and quarter) comes to a close.
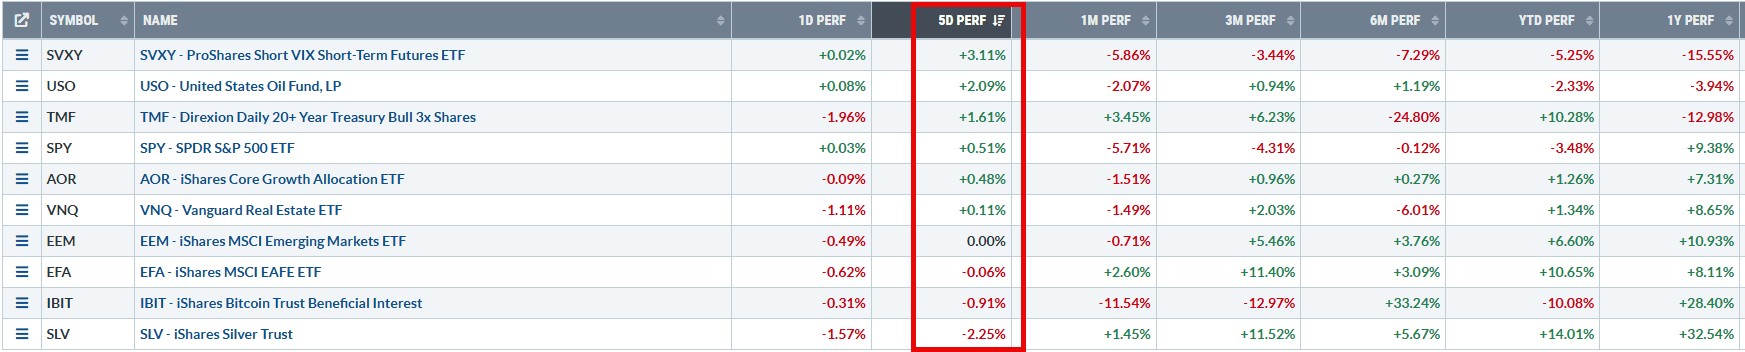
Equities, generally, saw very little movement last week with Oil and Treasuries outperforming and Silver (SLV) being the biggest loser. Because of the relatively low volatility, SVXY, the inverse volatility ETF was the best performer in the Rutherford-Darwin Portfolio (held only in the Darwin Portion).
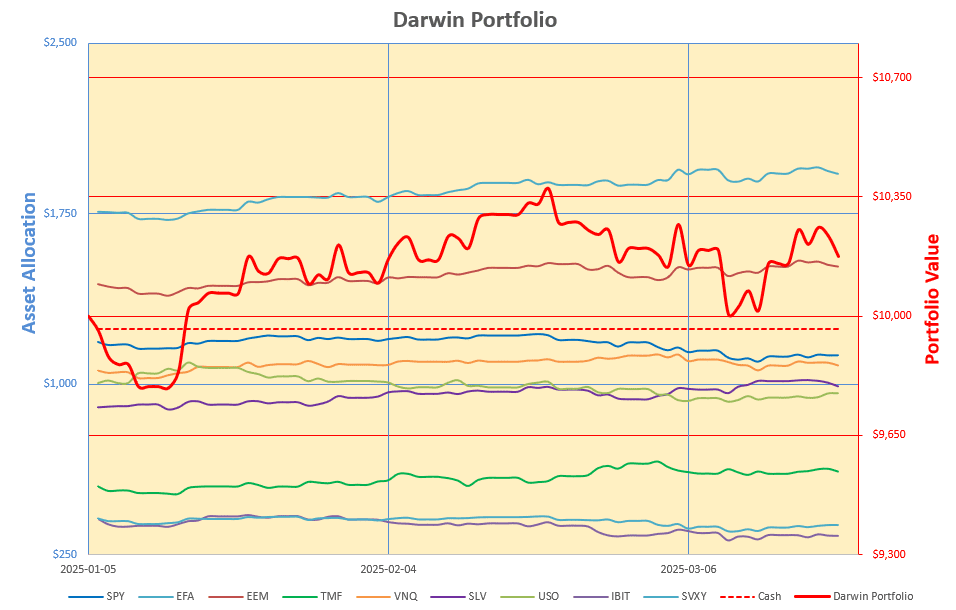
 A review of the Rutherford-Darwin portfolio shows a continued inflow from BIL (T-Bills) – now at $481 since inception just a little less than 3 months ago – and a small gain (~$22 or 0.2% of $10,000) in the value of the diversified “Buy-And-Hold” Darwin portion of the portfolio:
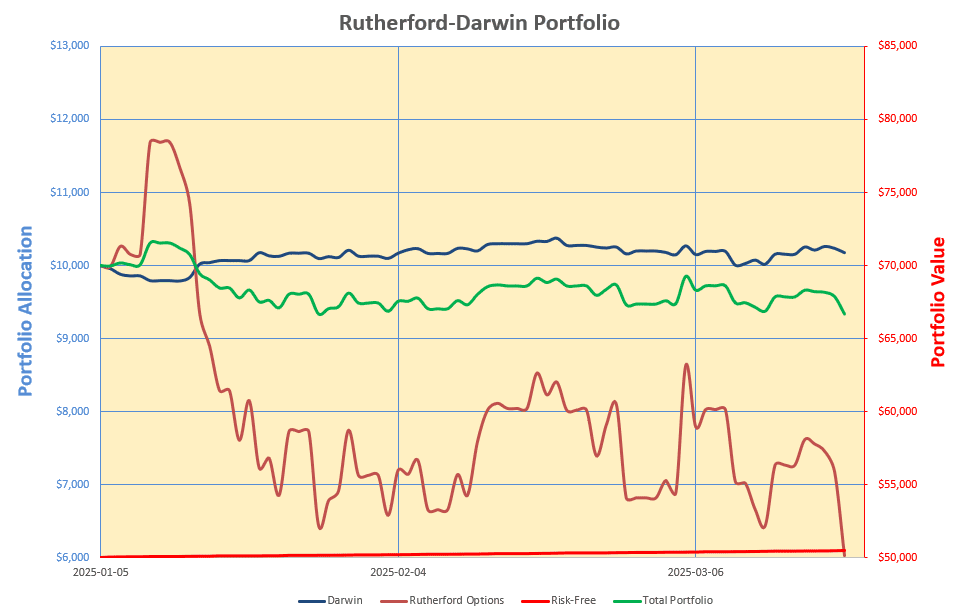
 Because of the time premium required to purchase Options, these derivatives require price movement to generate profits and we have not seen too much of that in the last 2 weeks. In addition, this coresponded to the last 2 weeks before expiration of the Options – where time premium decay is greatest. Time decay in Options does not occur in a linear fashion and accelerates as we near expiration. In retrospect, I should have rolled the Options held ~ 1 month before expiration to avoid (or at least minimize) this effect. However, I was trying to keep things simple – without success. In last week’s review I reported that I had sold some Options – so as to create Vertical Spreads – on most of the positions held. These Options expired worthless so I was able to keep the ~$400 premium received when I sold the Options and this reduced losses but did not compensate for a month’s time decay.
Here’s what the total portfolio performance looks like since inception:
Because ETFs, due to the high diversity in their holdings, tend to have much lower volatility than single stock purchases, it is more difficult to generate profits than for a portfolio of single stock assets. I have therefore decided that, if I am to continue to have a portion (~10%) of the portfolio dedicated to Options, that I will have to complicate things by selling premium in addition to purchasing it when I buy long (Call or Put) Options. In last week’s review (https://itawealth.com/rutherford-darwin-portfolio-review-14-march-2025/) I showed the profit/loss Risk Graphs of my current Bullish position in Silver (SLV) and Bearish position in Bonds (TLT). These are both positions with ~30 days to expiration when placed and I have both profit and loss targets set for exiting the positions. Since maximum profit and loss is always well defined when buying/selling Options it is much easier to manage risk – albeit with a little more effort – than holding stock or ETFs.
Since all my original positions have now expired – some positions (in EFA and EEM) were rolled to reduce risk/lock in profits – I have had to replace them going forward.
I will start with TLT, the Bond ETF, where I have now changed my views from bearish to neutral/bullish following statements made by the Fed this week. This, in addition to the bearish vertical spread mentioned above (and described in last week’s review), has resulted in me holding the following position (as defined by the profit/loss Risk Graph):
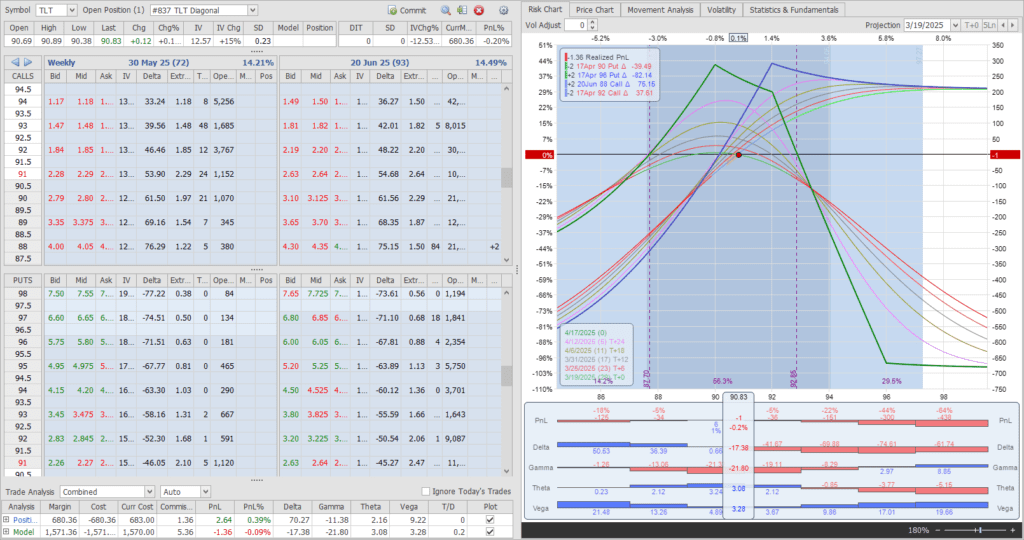 The Blue graph shows the new position placed this week and the green graph shows the combinbed positions when combined with last week’s position. These graphs show the profit/loss for all positions held – 2 Long Options (bought) and 2 Short Options (Sold). The intent of these positions is to offset the cost of premium paid to buy Options by the price received when selling Options. This cannot be accomplished completely in the purchase and sale of Options to create a Vertical Spread (last week’s position) but can be achieved by buying a longer term Option and selling (more than one) shorter term (weekly or monthly) Options against it. In the above example (blue line) I have bought 2 Call Options at the $88 strike price, expiring 20 Jun (in 93 days), and sold 2 Call Options at the $92 strike price, expiring 17 Apr (29 days). The extrinsic (time premium) value in the Options purchased is $1.50 per contract ($1.50 x 100 x 2 = $300 total cost on 2 contracts) and the extrinsic value in the Options sold is $1 per contract ($200 total premium received on 2 Contracts). Since the Options sold expire in April I can potentially sell more Options expiring in May and June to bring in another ~$200 per month to easily cover the $300 paid to buy the longer term Options. Of course, price will move in the next 3 months so I will need to monitor the position and adjust as necessary should price move significantly (~1-2 standard deviations). The new 88/92 “Diagonal” Spread has a 65% probability of profit. Over the next month, the profit/loss of the combined “Vertical” and “Diagonal” Spreads, is shown by the green graph and has break-even points at $87.80 and $92.85 – a $5.05 range with 56.3% probability of closing within this range. Maximum profit is ~$250 or ~17% Return on Margin (Risk) in ~ 1 month. I have set a (mental) max loss target of $375 and target profit target of $200 (~80% maximum profit) for a reward/risk of $200/375 or a little better than 1:2. In reality, I will be managing the spreads separately such that my maximum loss would be less than ~$225 – closer to 1:1 reward/risk. The combined positions have very low “Delta” – i.e. are not very sensitive to price movement – so should be fairly easy to monitor without having to sit in front of a screen all day – although they do require reviews more frequently than monthly.
One of my new positions is a “Diagonal” Spread in VNQ (Real Estate) and looks like this:
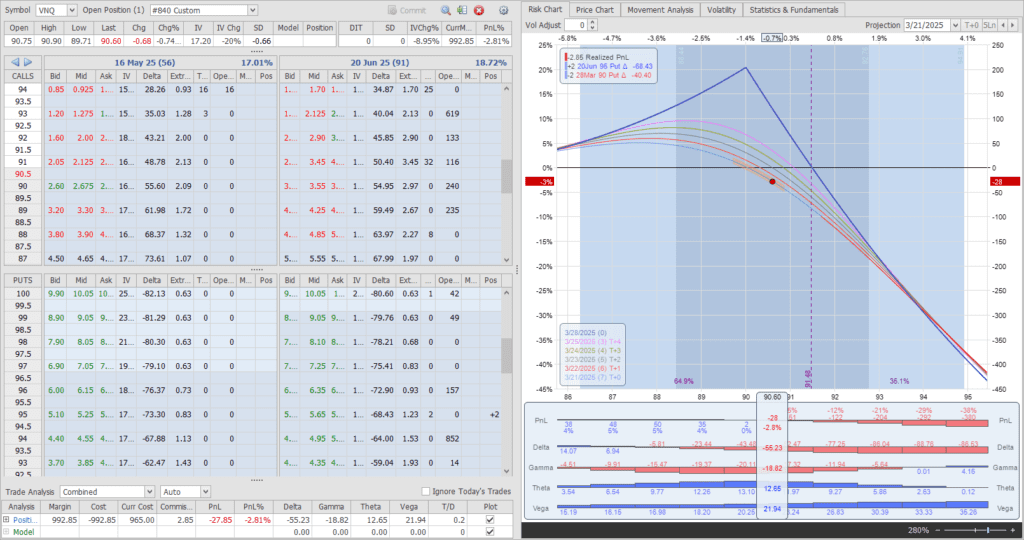 where I have Bought 2 Put Options at the $ $95 strike Price, expiring in June (91 Days) and Sold 2 Put Options at the $90 strike expiring in April (27 Days). As with the above TLT example I will have the opportunity to adjust/sell more premium over the next 3 months as prices move or approach expiration. In this example, the extrinsic value in the Options purchased was $1.23 per contract ($246 total on 2 contracts) and the (premium) credit received on the Options sold was $0.88 per contract ($176 total) – again with potential to sell more premium over the next 3 months).
VNQ is another position where I have changed my views from Bullish to Bearish:
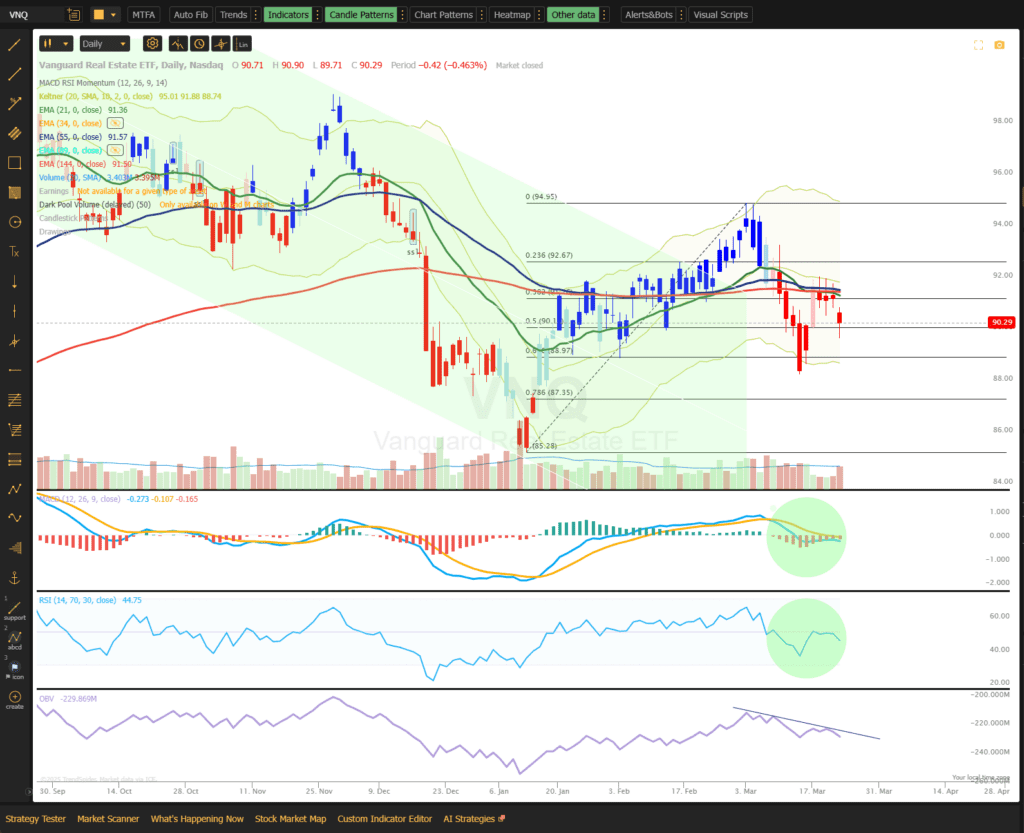 The above screenshot shows the price chart for VNQ together with the MACD (as described by Lowell in https://itawealth.com/?s=MACD ) in the top panel below the price chart and the RSI (momentum indicator) in the centre panel. As another itawealth member noted in one of his comments these 2 indicators are often used together for confirmation of momentum and trend. The chart is colored such that the candlesticks are colored blue when the indicators are in agreement for bullish moves and red when the indicators are in agreement for bearish moves. At the moment the suggestion is that we are in a bearish trend with confirmatory bearish momentum. Also included in the above screenshot is a plot of On Balance Volume (OBV) that has a negative slope suggesting that money is flowing out of VNQ – although volume has not been particularly high over the past week – so not a lot of conviction or evidence of recent institutional buying or selling. One of the advantages of using “Diagonal” Spreads is that it is easier to move from bearish to bullish positions and vice versa.
Since most existing positions held Options that expired on Friday, new positions were also initiated in VOO, EFA, EEM (all equity ETFs), USO and IBIT.
As an example, the following screenshot shows the position in EEM:
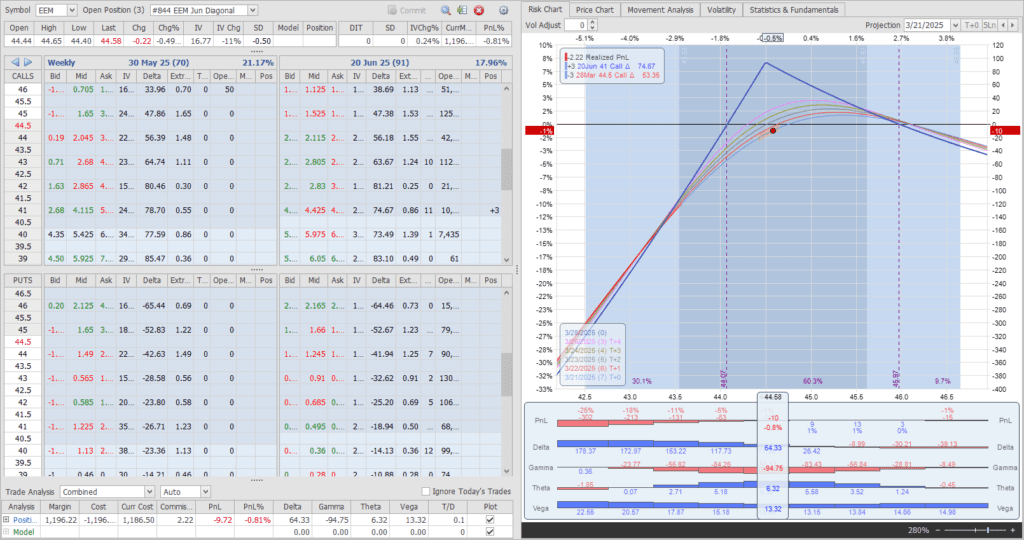
This is again a “Diagonal” spread similar to the ones shown above for TLT and VNQ except that in this case the Options sold expire in one week rather than one month. Obviously this does not bring in quite as much premium but Options can be sold more frequently (weekly). This takes more time/effort in monitoring/adjusting but I want to see which strategies work best – I have some ground to make up in this portfolio 🙂 . My positions in EEM and EFA are both bullish positions like the one above. USO is a bearish “Diagonal” Spread, again using the weekly expiration Options for the short leg. Next week I will report on the “roll” of the short leg in all these positions.
VOO is a one month bearish Vertical Spread (rather than bullish as for other equity markets) as is my new position in IBIT.
As noted above I am building examples of the different strategies/options within those strategies to try to determine which are the best strategies to employ.
Anyone wanting more details of trades not specifically described in detail in this post please let me know in the comments below and I will be pleased to send them to you. I recognize that most members reading this blog will not be interested in getting into these more work-intensive strategies so I don’t want to clutter things up more than I need to.
Discover more from ITA Wealth Management
Subscribe to get the latest posts sent to your email.
David,
Is there a link to the VNQ MACD graph available to readers? If this does not require a subscription that graphical information would be useful to readers so they can check their own security tickers.
Lowell
Lowell,
Unfortunately the software required to generate those charts/graphs is a subscription service – and not an inexpensive one! The main reason that I have “invested” in the software is because it includes capabilities for AI analysis/system development that I wanted to take a look at. At this point I am not convinced that AI software is at the stage of being totally efficient when it comes to investment/trading, I’m sure that this will improve with time but that’s my initial reaction – but after only ~1 month of playing with it. The software does include other interesting information – such as what Nancy Pelosi (and other members of the House and Senate) are buying/selling and what institutions are buying and selling in the “dark pools” outside of the major exchanges. And, of course, the ability to generate the graphs with confirmation of re-inforcing indicators is very nice. But I would hesitate to recommended it (at the price) to anyone but the most serious/dedicated investor/trader. For anyone interested in checking it out it can be found at TrendSpider.com.
David
Correct about the pricing — thanks for the citation.