
Hostal in Peru
Pauling is the Dual Momentum™ portfolio scheduled for an update this morning. Of all the portfolios tracked here at ITA, Pauling is the poorest performer when it comes to annualized Internal Rate of Return (IRR) results. As a result, I am changing the look-back period as I will show and discuss in the first screenshot.
Pauling Dual Momentum™ Recommendation
I had been using a 60- and 100-trading days look-back combination. This is the default setting that comes with the Kipling and was based on extensive back-testing. That look-back combination has not worked well for the Pauling so I am reverting to the one-year or 252 trading days look-back. See the green arrow. 100% is allocated to the 252 trading days.
The Kipling is set to the DM model (see purple arrow on the right) and only one asset is recommended at a time. The Pauling currently holds several assets including approximately $10,000 in cash.
TSLOs are set for VEU, BND, and VOO. Since SCHP is an inflation protector I’ll continue to hold on to that ETF. Available cash will be used to purchase shares of SHY.

Pauling Performance Data
Over the past year the Pauling is lagging the AOA, but it is outperforming the broad environmental ESGV Vanguard fund. I plan to give the Dual Momentum model another year before I think about making a change with this portfolio. It all depends on how the Sector BPI model works out as we progress through 2023.

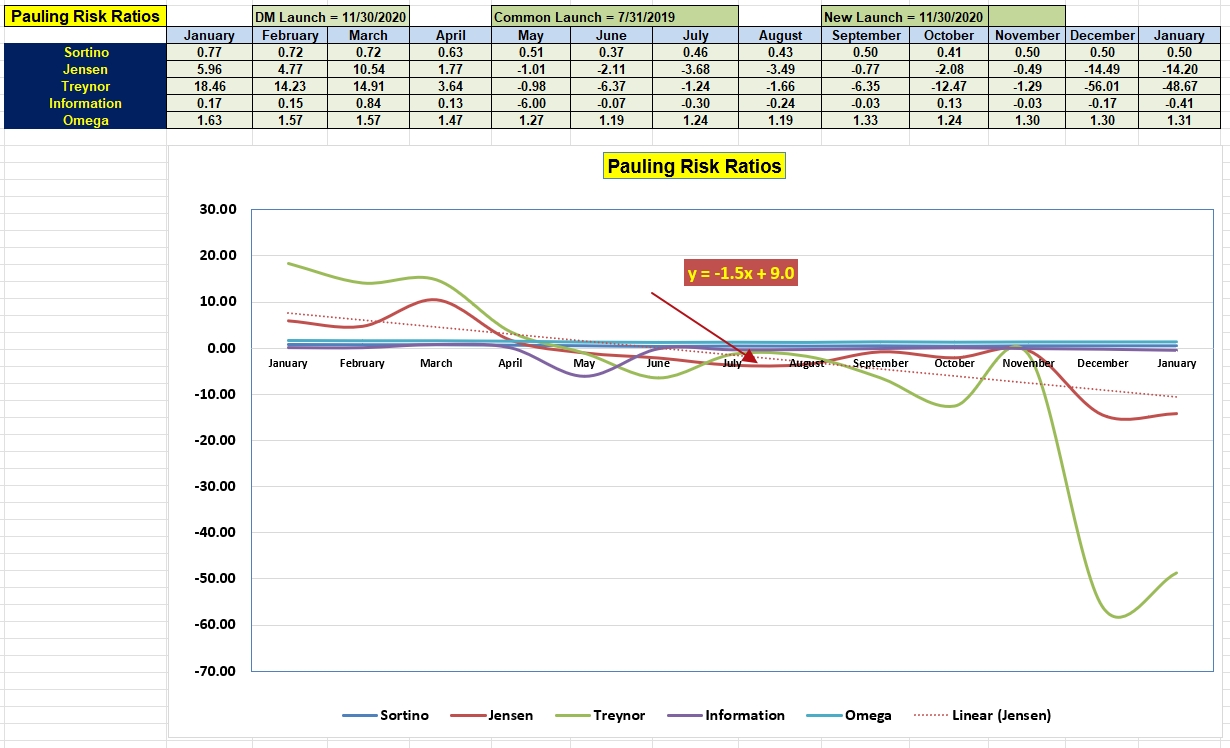
Pauling Risk Ratios
The most recent months have been difficult ones for the Jensen Alpha. Keep an eye on the Jensen and Information Ratio as we move through the summer months. Once we clear March the slope of the Jensen should show improvement.
Discover more from ITA Wealth Management
Subscribe to get the latest posts sent to your email.
You must be logged in to post a comment.