
Columbia River – Astoria, OR
Copernicus is a Buy & Hold portfolio where the only holdings are U.S. Equities. The philosophy behind the Copernicus is to purchase shares in one of four U.S. Equities ETFs and never sell unless there is an emergency. Thus far this is the top performing ITA portfolio as it now holds a commanding lead of 13.2% (annualized) over the S&P 500 (SPY) benchmark. How can this be if one is investing only in U.S. Equities? During the down market of 2022 shares of VOO, SPY, ESGV, and VTI were added to the portfolio at low prices. This is known as dollar-cost-averaging and that benefited the Copernicus. The reverse will impact the performance when shares are added during market high points.
Copernicus Security Recommendations
Below is the investment quiver for the Copernicus. ITA readers could easily duplicate this portfolio by investing only in SPY or VTI. There is much overlap in the stocks held when one holds shares in all four ETFs as is the case with the Copernicus. The current investing model is working for the Copernicus so why change it.
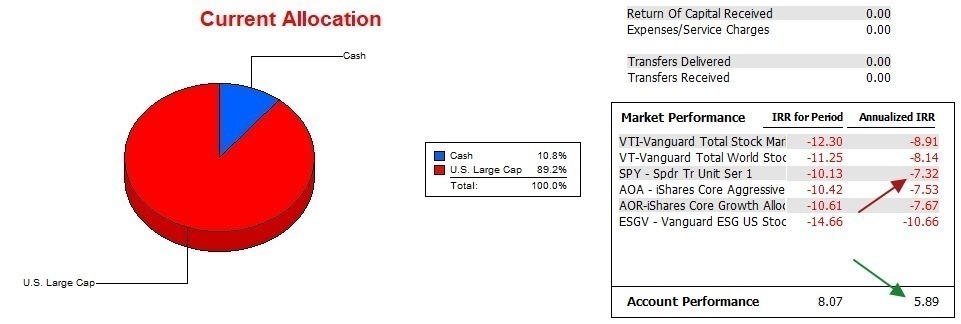
The Copernicus currently holds nearly 11% in Cash and that is a large amount for this portfolio. Based on the following worksheet from the Kipling spreadsheet I plan to purchase more shares in ESGV and VOO when the market opens on Tuesday.

Copernicus Performance Data
The Copernicus was launched on 1/17/2022, but I use 12/31/2021 as the launch date since the Investment Account Manager only retains end of month data. Over these 17 months the Internal Rate of Return for the Copernicus is 5.9% while the S&P 500 (SPY) lost 7.3%. These are annualized figures. The following table also shows the IRR for the entire period.
Copernicus Risk Ratios
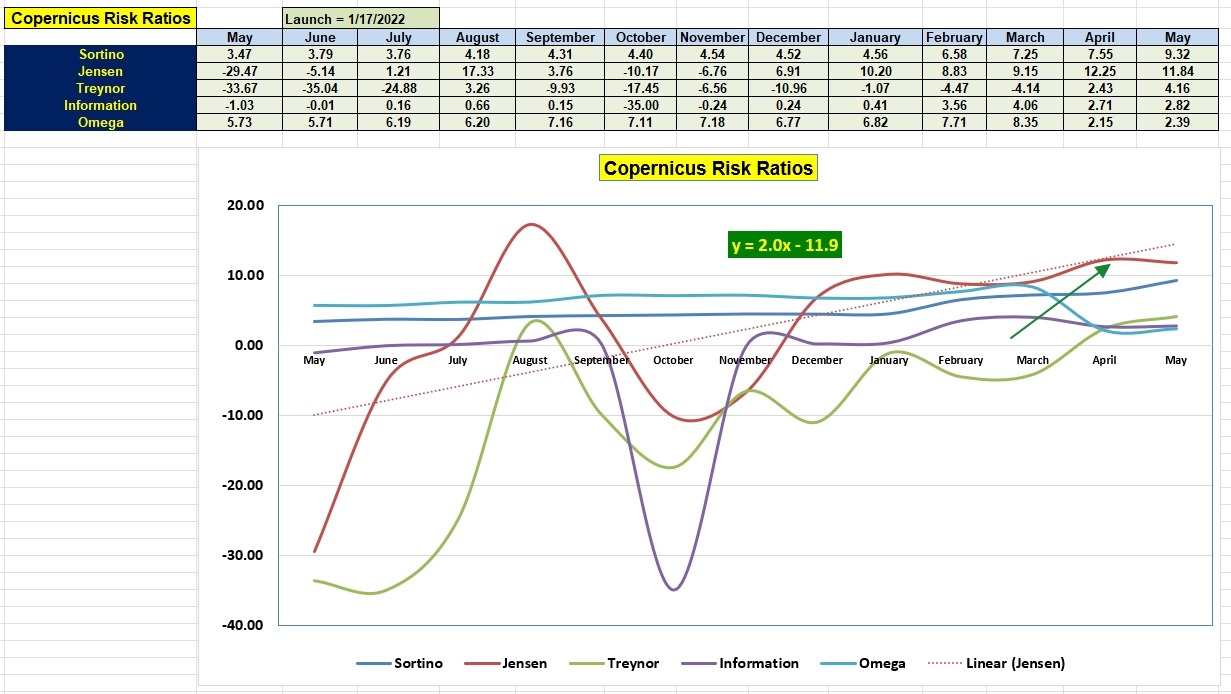
The following table examines the risk for an all equity portfolio and there is actually minimum risk. This is contrary to “popular” opinion. If one wishes to manage a portfolio where there is a greater chance of tempering major bear markets, then take a close look at the Sector BPI Plus management model.
The 11.8 value for the Jensen Performance Index is exceedingly high and will be very difficult to maintain. Any positive value is considered to be excellent.
Readers should also pay attention to the Information and Sortino Ratios.
Portfolio Summary: 16 January 2023
Copernicus Buy & Hold Portfolio Review: 18 May 2023
Tweaking Sector BPI Plus Model: 20 May 2023
There is another “tweak” coming for the Sector BPI Plus portfolios.
Discover more from ITA Wealth Management
Subscribe to get the latest posts sent to your email.
Lowell,
The risk numbers are impressive – to what do you ascribe the superior performance of the Copernicus considering that the selection choices are essentially slightly different flavors of SPY or the other equity benchmarks – and all held over the same period?
David
David,
As I tried to explain, the owner added new money rather regularly through the down market of 2022. Shares of different U.S. Equities were purchased at lower prices compared to where the prices are today. I don’t think it really mattered which ETF was selected as all were priced well below today’s prices. When the market began to rebound, those ETFs that were purchased during the bear market began to produce excellent results based on IRR calculations.
The reverse could easily have happened if the portfolio were launched on January 1, 2021 as the ETFs would have been purchased at much higher values.
Over the long run, dollar-cost-averaging works very well so long as the long-term trend of the market is up.
Lowell
That’s where I’m having problems understanding Lowell, the trend in the market since Dec 2021 is down, not up. It is up since Oct 2021 – but the IRR calculations should build this in. Something still isn’t making sense to me.
Hedge,
I’m relying on the accuracy of the Investment Account Manager software. All entries match the broker statement.
I’ll check, but I think the IAM software is calculating IRR-ROI rather than a Time-Weighted IRR-ROI.
Money added during the last quarter of 2022, when the market began to recover, is contributing more to the positive IRR calculation as the time period is shorter and the shares were purchased at lower prices.
I don’t plan to use XIRR in Excel to check the values as IAM has a good reputation for accuracy.
Lowell
PS I think you meant to state “up since Oct 2022” not Oct 2021. Correct?
Yes, Oct 2022
David,
While VOO, ESGV, and VTI overlap SPY, all were not held over the same period. I purchased different amounts of all four ETFs at different times between January 17, 2022 and last Friday, May 27, 2023.
This is why the IRR for the portfolio varies significantly from SPY.
Lowell
Lowell,
I would classify this as a good example of review-date/timing luck rather than system performance since there is really no “system” here – it’s just a matter of adding more of the same at different times. Nevertheless, something to ask ourselves – is it worth the effort to diversify when we can simply “dollar-cost-average” a single asset? I think the answer to this is no – provided that the asset is the best relative performing asset over the period 🙂
David