
“Big Bird” Wood Statue at Vidanta World, Nuevo Vallarta, Mexico
It was a rough week all around with US Equities (as represented by the SPX – S&P 500 Index) closing down ~ 1.8% on the week:
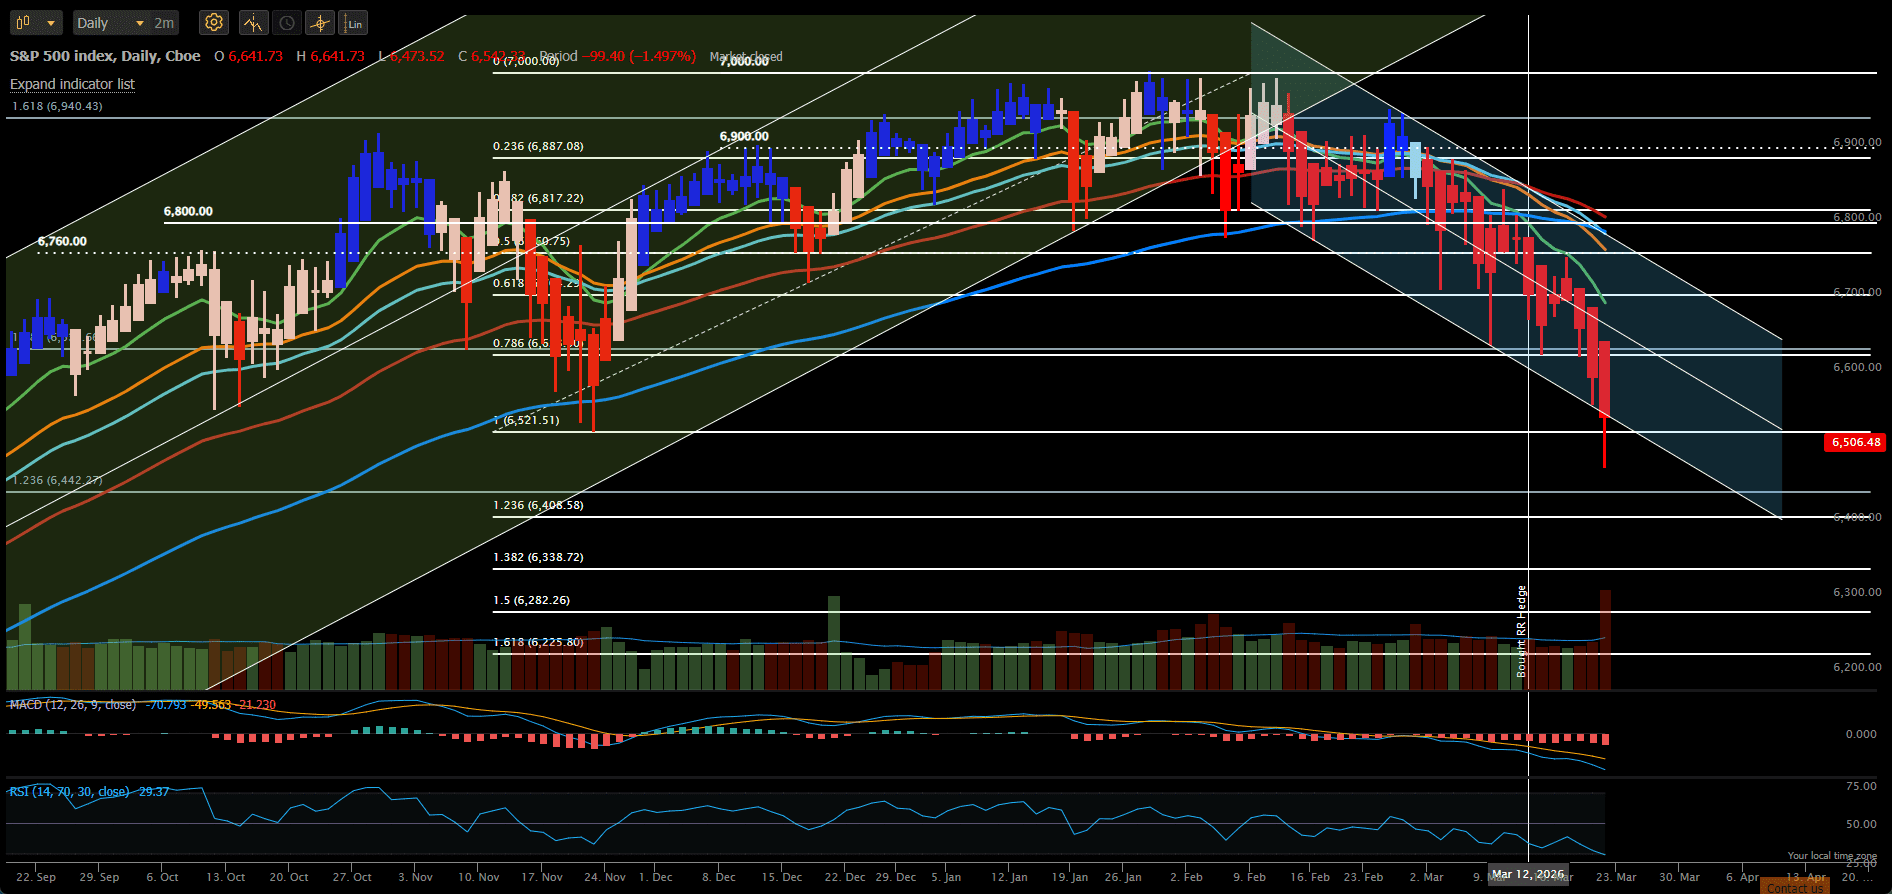
We are now sitting at ~6,500, or the pullback low established in mid November 2025. We will wait to see whether this potential support level holds and we see a bounce (likely if there is a quick resolution to the wars with Iran) or whether investors remain fearful and we see a continuation of this downtrend in which we are sitting at the bottom of the channel. If we continue on this pullback/correction we could easily see the next significant support in the 6,200-6,100 range (around the February 2025 highs – before the “tariff wars”).
As noted above, the recent weakness was not only confined to US equity markets:
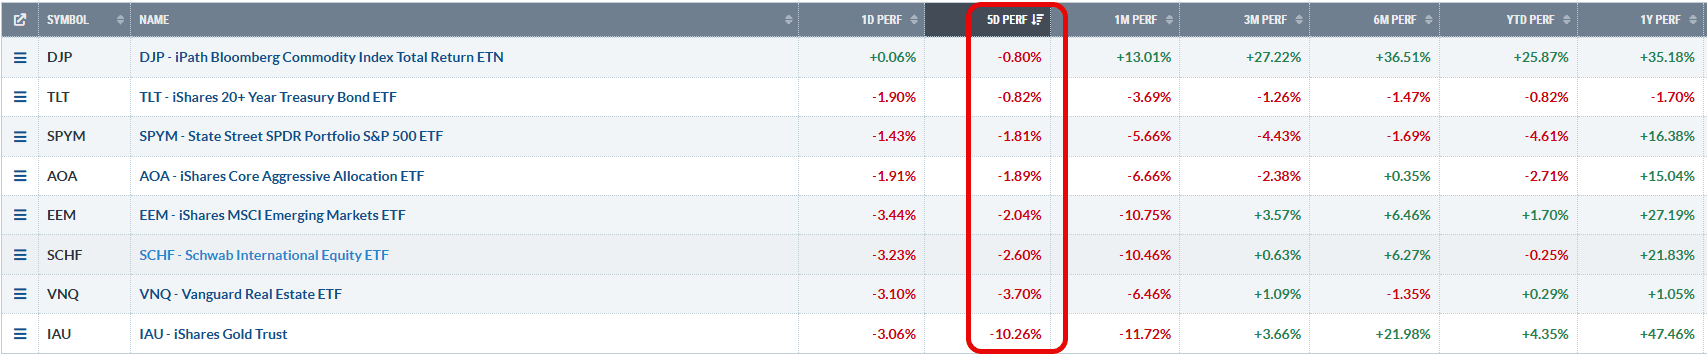 but was reflected in all the major asset classes. Despite a small decline, Commodities (dominated by Oil/Energy) remained the strongest asset class with Gold (perhaps unexpectedly) showing the largest decline with a 10% loss on the week. It is difficult from these observations to see where all the money is going/rotating to – maybe under the mattress?
How did the Darwin Portfolio fare this week through all this turmoil?
Here’s a look at the current analysis sheet:
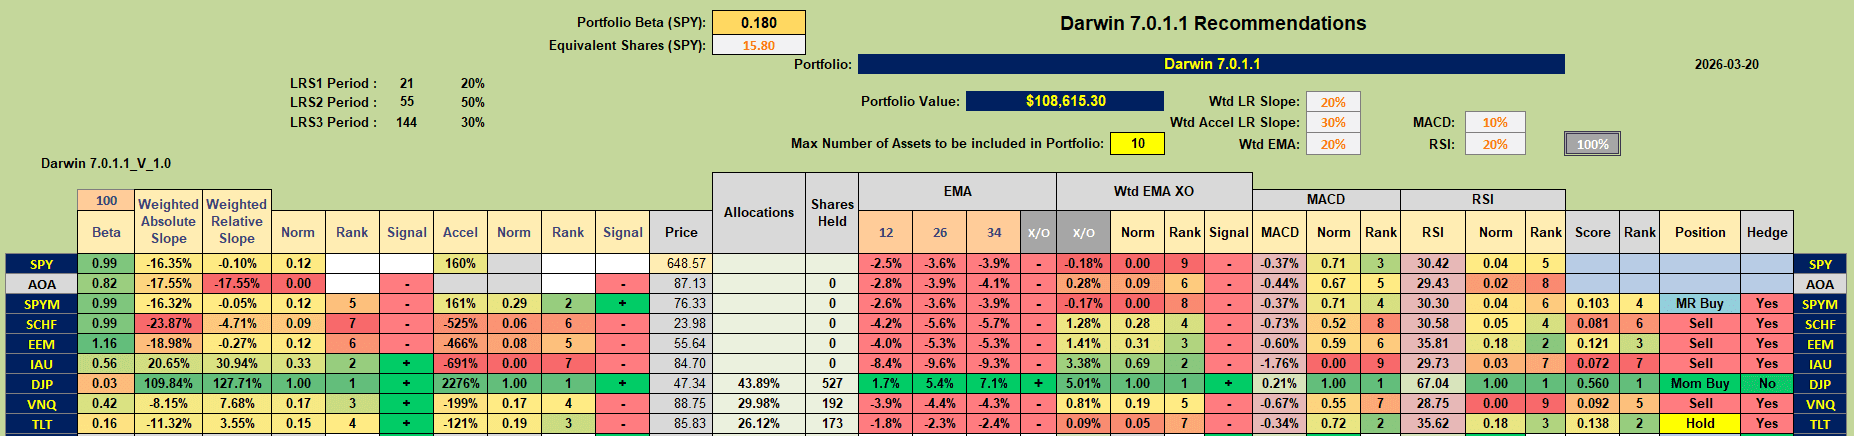 where we see potential Buy recommendations for DJP (Commodities) and SPYM (US Equities) and a Hold recommendation for TLT (US Treasuries). At the beginning of the week IAU (Gold) was also held in the portfolio but was sold on Wednesday as this signal developed:
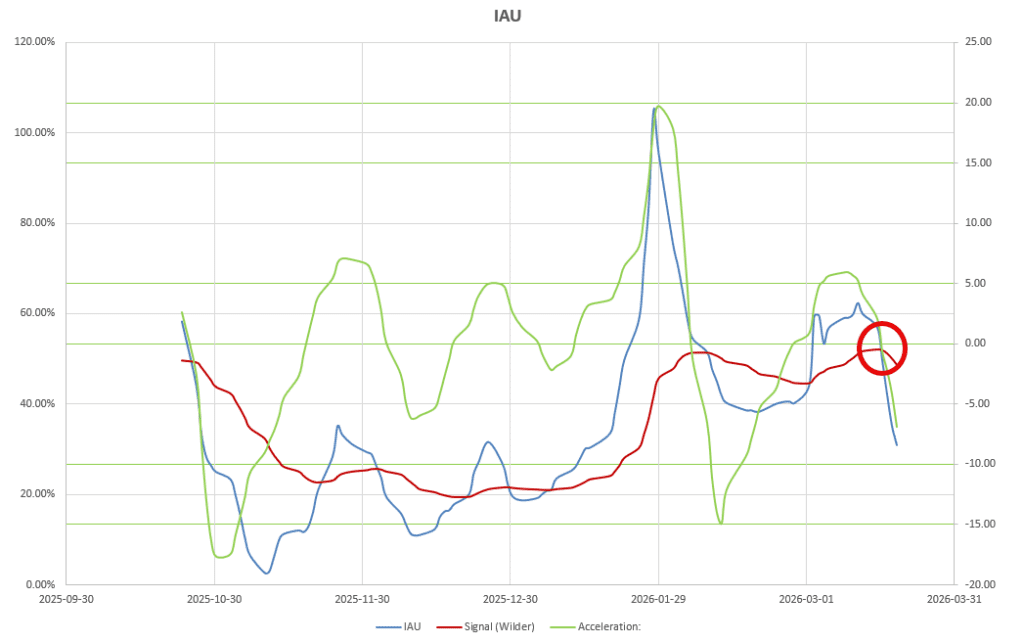 where acceleration (rate of change of momentum) turned negative (green line – right hand axis) and momentum, while remaining positive in the longer term, crossed below it’s Wilder moving average (blue line crossing brown line).
Thus the Trade sheet now looks like this:
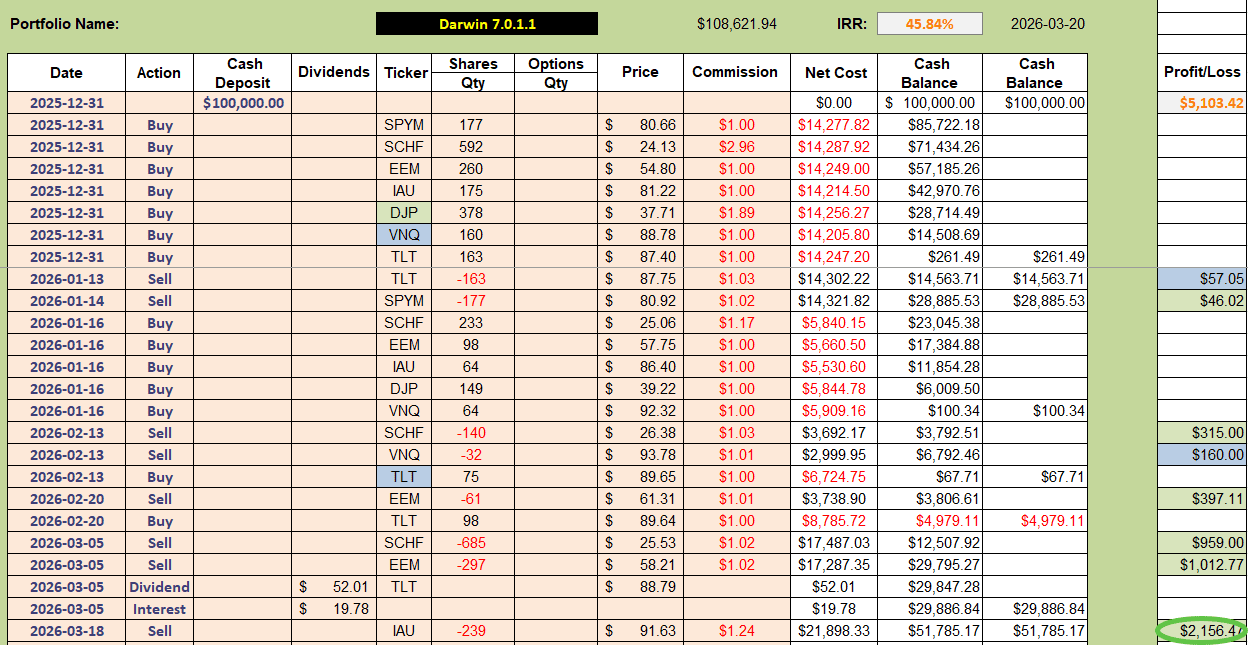 and a lock-in profit of $2,156 on the Gold position.
Current suggested allocations/positions look like this:
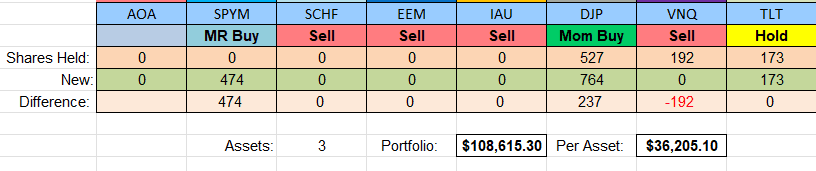 with a suggested Sell on VNQ (US Real Estate and a suggested Mean-Reversal Buy on SPYM (US Equities). So, let’s take a look at the graphs:
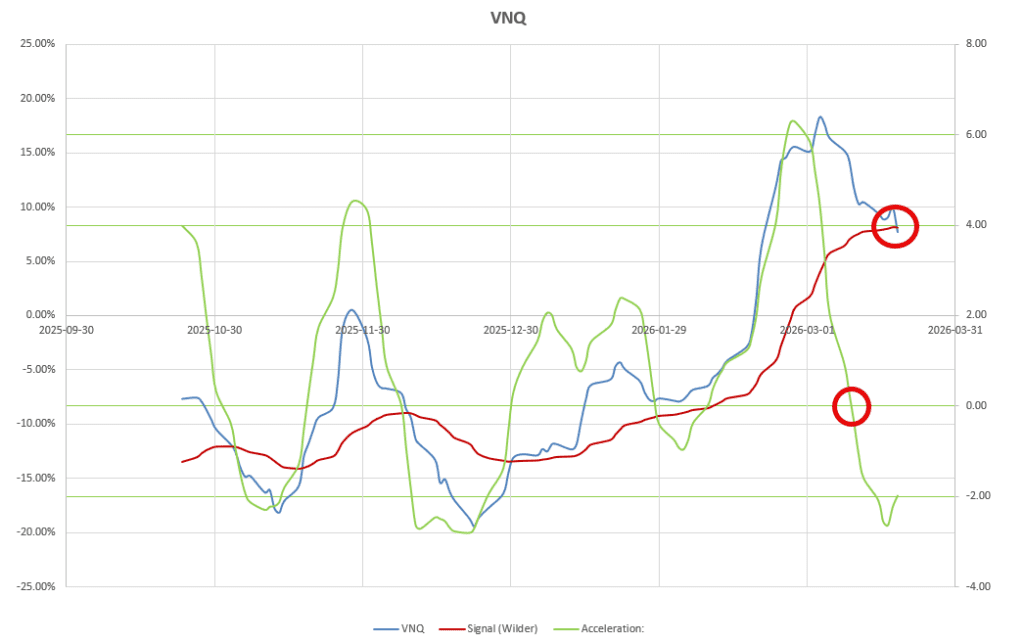 after crossing the zero line on 10 March, acceleration turned negative – giving the first indication of weakness. This was then confirmed on Friday as momentum (still long-term positive) crossed below it’s Wilder moving average. If VNQ drops below it’s previous day’s low next week I will be selling current holdings in VNQ.
As for SPYM:
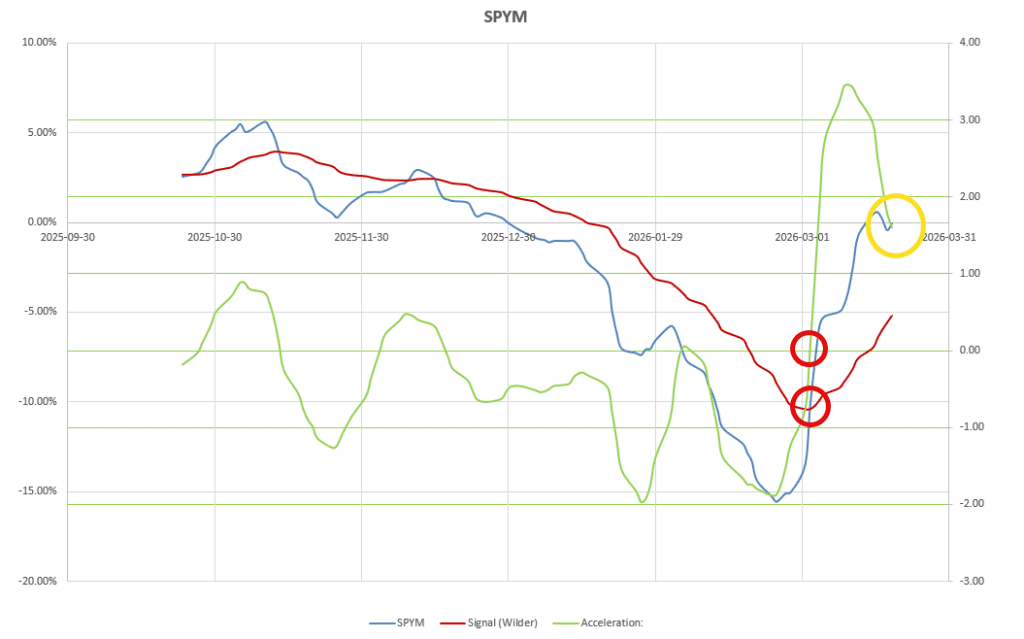 although this has been showing a potential Mean-Reversion Buy recommendation since 3 March (red circles) the daily changes have not been encouraging and so I have been holding off from opening a position. Long term momentum (relative to the benchmark – that is currently in a negative trend) is hovering around zero so, although momentum remains above it’s Wilder moving average, until I see more conviction in momentum and, certainly in acceleration, I will refrain from opening a position here. However, I will continue to monitor closely for a possible entry later.
For the sake of completeness, let’s take a look at TLT that is suggesting a Hold position:
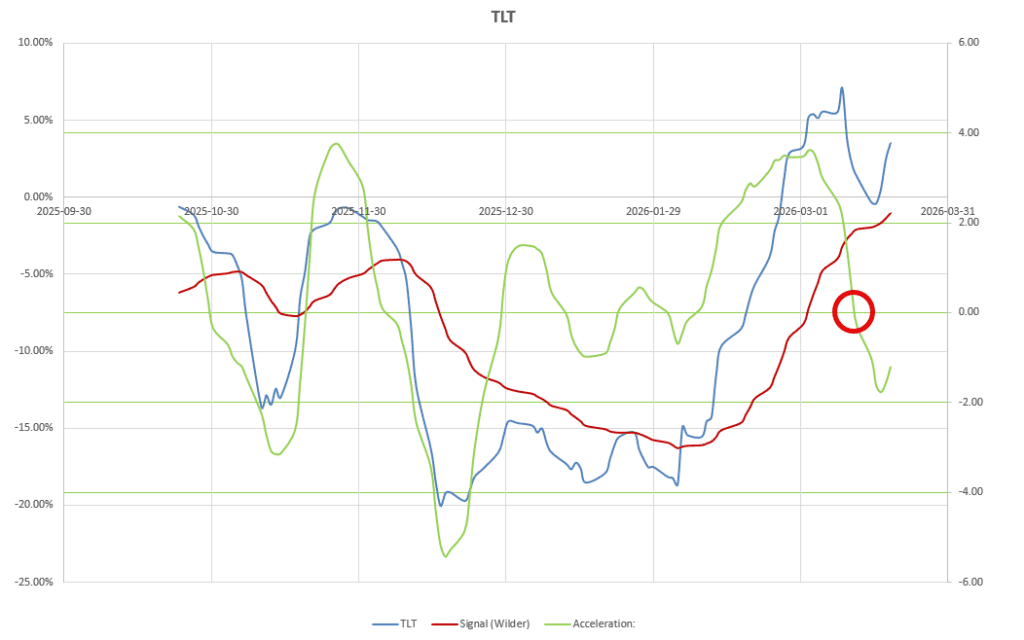 here we see an early-warning sign where acceleration has recently turned negative. However, at present we still have positive momentum that remains above it’s Wilder moving average. Consequently I will continue to hold TLT and may add to the position should acceleration turn positive.
From the allocation table above, if I am to hold 3 assets in the portfolio with equal weighting, I am presently under-allocated in DJP and so, if the bullish trend to this ETF continues I may well add to my current holdings.
I have spent a little more time, in this review, to try to explain how I am managing this momentum/mean reversion system that I started at the beginning of the year. So far, the results/performance have exceeded my expectations:
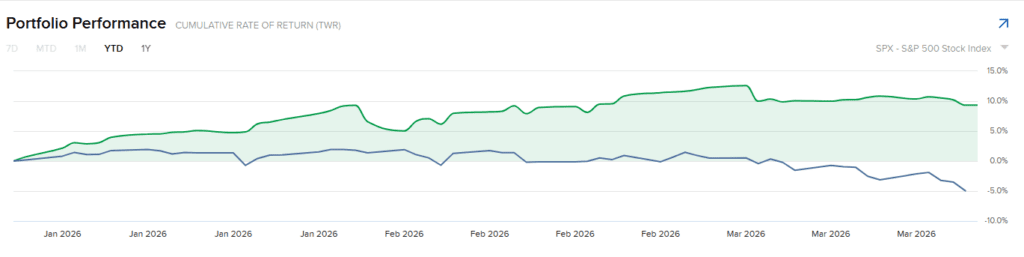
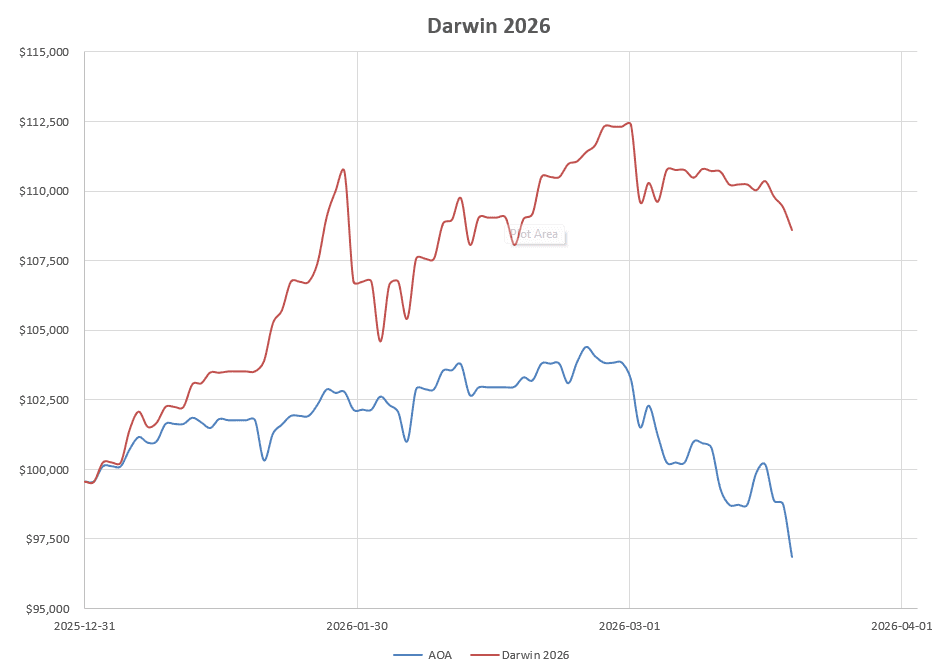 with the portfolio showing close to a 10% profit vs the benchmark’s ~2.5% loss.
This is a plot from my trading platform showing performance relative to the S&P 500 Index that is down ~5% over this time period:
In addition, although not formally part of this portfolio, here’s a look at the portfolio hedge that I opened when we broke out of the 6,800-7,000 consolidation range and it looked as though we might be entering a downtrend:
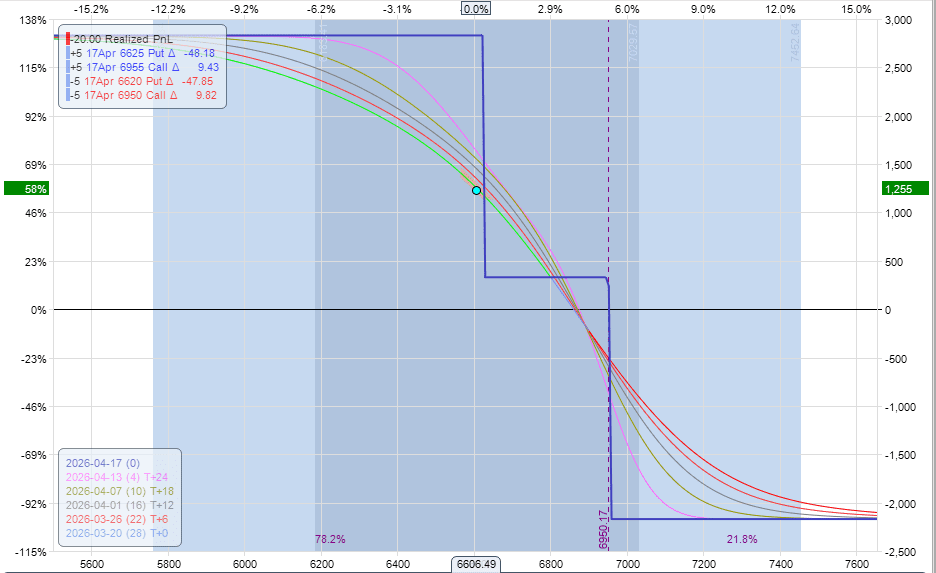 This Option Position (a risk-reversal trade https://itawealth.com/portfolio-hedging/ ) is presently showing an unrealized profit of ~$1,250.
Discover more from ITA Wealth Management
Subscribe to get the latest posts sent to your email.
Today I sold my position in VNQ and added to my existing position in DJP. At present, with only 2 positions, I am slightly less than 50% invested.