
Halloween Dinner
During this year (2024) several portfolios were shifted to the Asset Allocation investing model in an effort to return to my investing roots. The Einstein is one such portfolio. What I am attempting to do with these portfolios is to get each one close to the recommended percentage for each asset class. The percentage recommendations come close to the percentages recommended by David Swensen, William J. Bernstein, and Rick Ferris. Other authors also enter the recommended percentages, but these fellows carry a lot of weight with the asset allocation recommendations. There might be slight variations from portfolio to portfolio based on the owners needs.
I plan to revisit the Einstein later this month and again in December in an effort to bring all asset classes within +/- 1.0%. For larger portfolios or those holding assets greater than $100,000 the balance percentage is +/- 0.5%. Bringing portfolios into balance is easier if new money is added. Otherwise I need to rely on dividends to do the rebalancing. If prices change significantly it is not as easy to keep the different assets in balance.
Einstein Asset Allocation Portfolio
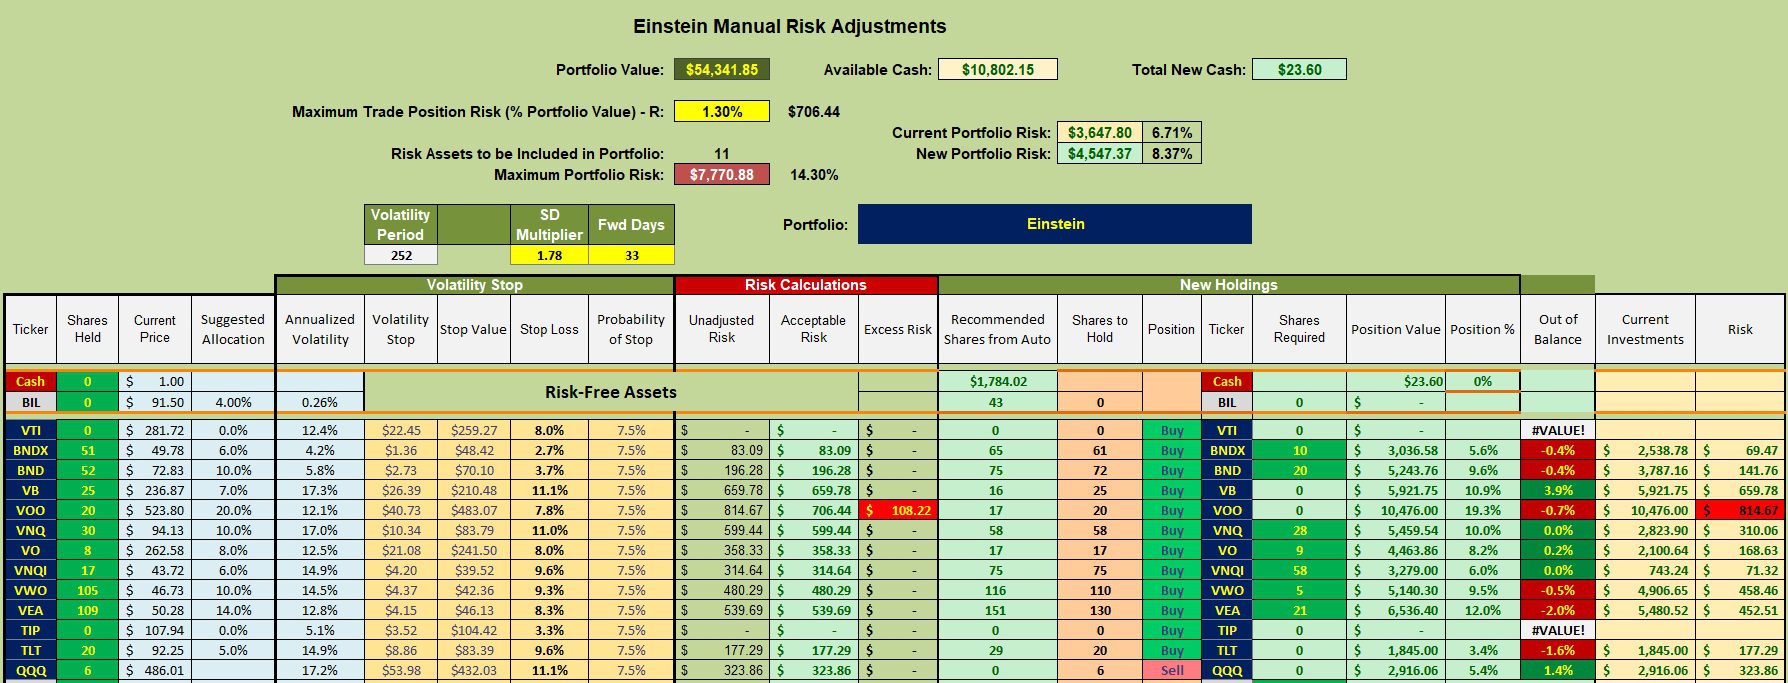
Below is the current asset allocation investment quiver for the Einstein. Since I began writing this blog several limit orders were struck. Thus the need to revisit this portfolio again in late November.

Einstein Rebalancing Recommendations
In the sixth column from the right readers will see the number shares to purchase for several different asset classes. This will still leave several asset classes below target such as VEA and TLT. This particular portfolio was used to fund educational expenses. Now the owner plans to build back the portfolio which will make it much easier to bring the portfolio into balance over the next few months.
Einstein Performance Data
Since 12/31/2024 the Einstein lags the AOR benchmark by several percentage points. Over the next few months we need to watch the growth direction and for that information we look to the Risk Ratio data. Risk Ratio information is found in the next screenshot.

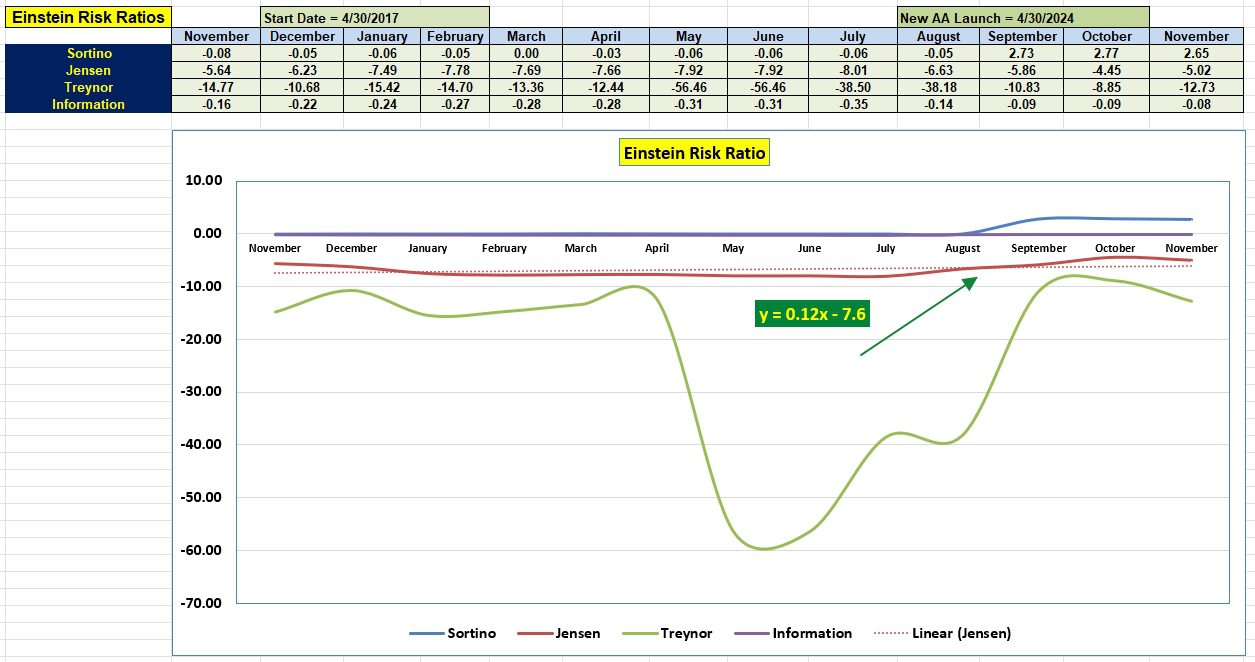
Einstein Risk Ratios
For the most useful comparisons as to the direction of the Einstein, compare the October data with November of last year or what is in the far left column. Another growth trend is the slope (0.12) of the Jensen Performance Index.
For additional comparisons, check the Information Ratio. November (-0.08) is higher than October (-0.09) by a small amount indicating the portfolio improved or grew faster than the benchmark. However, the Jensen lost ground, -5.02 to -4.45. In other words, the risk factors embedded in the Jensen calculation overshadowed the return or performance gains. Ideally we want to portfolio to show gains for both the Jensen and Information Ratio.
Returning To Investing Roots: 5 August 2024
The Argument for Self-Management
Constructing a “Core” Investment Portfolio : Part 3 – Risk Parity and Volatility Targeting
Questions and Comments are always welcome. Pass on the https://itawealth.com link to friends and family.
Discover more from ITA Wealth Management
Subscribe to get the latest posts sent to your email.
You must be logged in to post a comment.