
Hillsboro Air Show
Kepler, one of two Relative Strength portfolios, is up for review today. Over the past 14 months neither the Einstein or Kepler have demonstrated the performance/risk level expected of this model. Regardless, I’m going to continue testing this investing model as we need to see how it works in something other than the poor investing environment of 2022.
As a reminder, the Copernicus and Schrodinger are by far the easiest investing models to manage and both rank in the top third in both performance and risk.
Kepler Investment Quiver
We begin the Kepler analysis for March with a look at the investment quiver. The portfolio currently holds 10 securities and that number will soon be reduced to the recommended five (5). As you will see in a moment, holding over $100,000 in cash is not a major issue with this portfolio.

Kepler Securities Recommendation
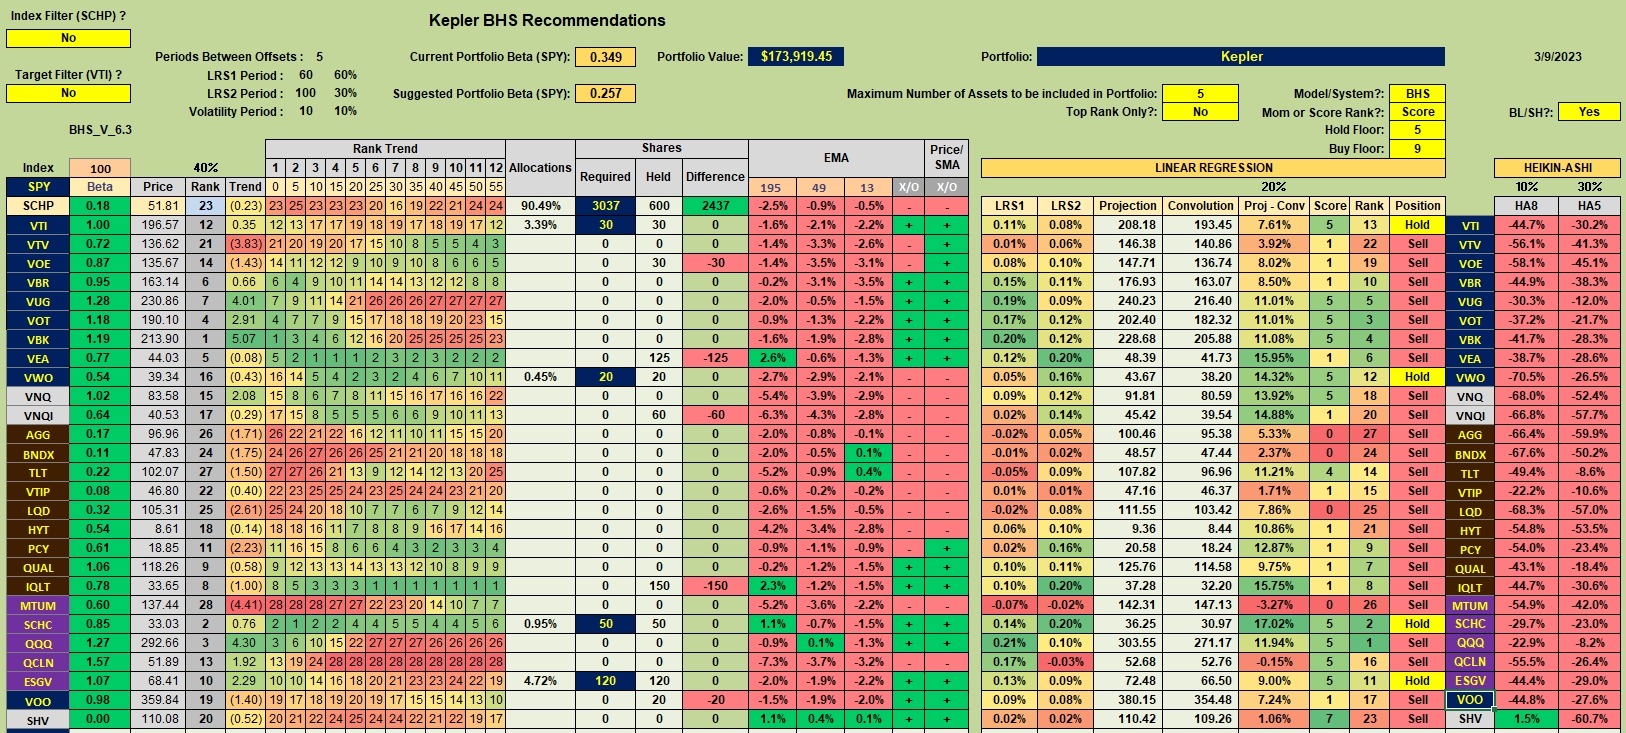
Below is the Tranche worksheet from the Kipling spreadsheet. This spreadsheet is required when managing Relative Strength or Relative Momentum portfolios. Note that I set the investing model to BHS and the default look-back period is applied.
There are no Buy recommendations, reflecting a weak stock and bond market. We do have four Hold positions and they are: VTI, VWO, SCHC, and ESGV. For this review I turned off the VTI target filter.
Kepler Manual Risk Adjustments
The first order of business is to sell all shares of VOE, VEA, VNQI, IQLT, and VOO. I plan to use Limit Orders for the Sell recommendations.
The plan is to use available cash to purchase short-term treasuries (SHV).

Kepler Performance Data
How has the Kepler performed over the past 14 months? While this portfolio did not outperform the AOA benchmark, it did manage to best the S&P 500 (SPY) by one percentage point. The Kepler did even better against the total market ETF, VTI.
It is important not to just concentrate on the red, but to know how well the portfolio performed vs a benchmark.

Kepler Risk Ratios
The following table provides portfolio information not found elsewhere on the Internet. Here we check a few important Risk Ratios and the most important ones are: Sortino, Jensen and Information. Note that the Jensen and Information are showing modest improvement over the past 10 days.
The slope of the Jensen (-2.2) is very disappointing and that is a value I need to work on to improve. It is going to take a few strong market months before the Jensen slope turns positive.

The ITA Wealth Management site is now free to all who sign up for a Guest membership. Former Platinum members have been grandfathered into the Lifetime membership level. There is now no monthly cost to read ITA.
Next week will be moderately busy as there are several portfolios up for review.
Discover more from ITA Wealth Management
Subscribe to get the latest posts sent to your email.
You must be logged in to post a comment.