
Glendalough, Ireland
It has been a few weeks since I last reviewed the Dirac Portfolio although I have made a few adjustments in this time period as shown in the following screenshot (red box):
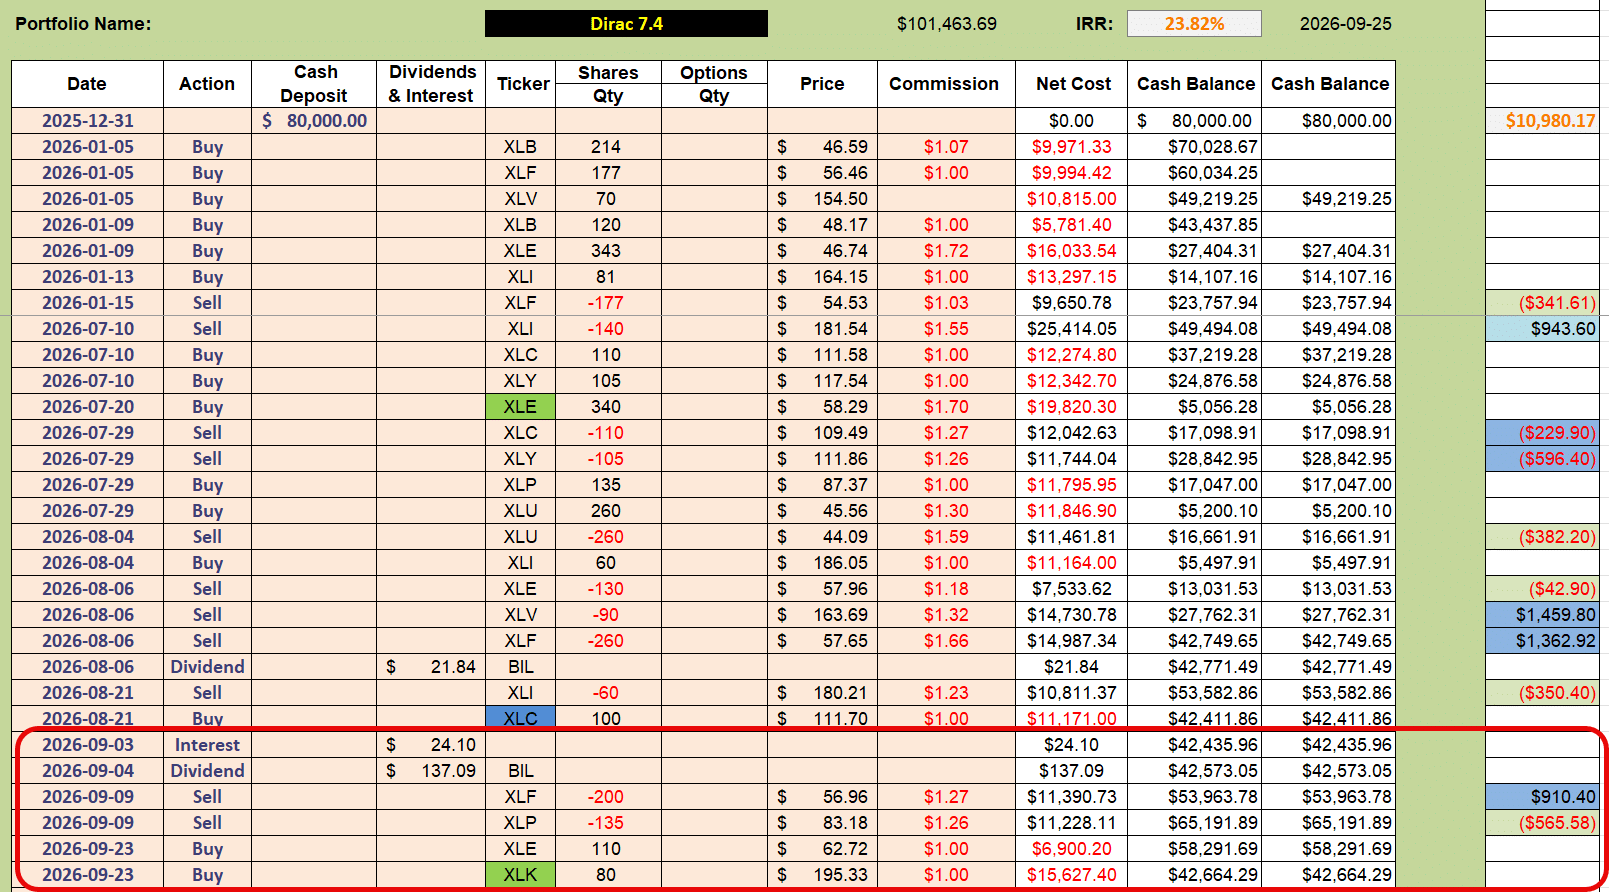 Significantly, on 9 September I sold out of my positions in XLF (Financials) and XLP (Consumer Staples) when the analysis sheet and Momentum/Acceleration graphs generated Sell signals. Financials were closed at a ~$900 profit and Staples at a ~$560 loss. More recently, on 23 September I opened a position in XLK (Technology) and added to my existing position in XLE (Energy) as the current analysis sheet looks like this:
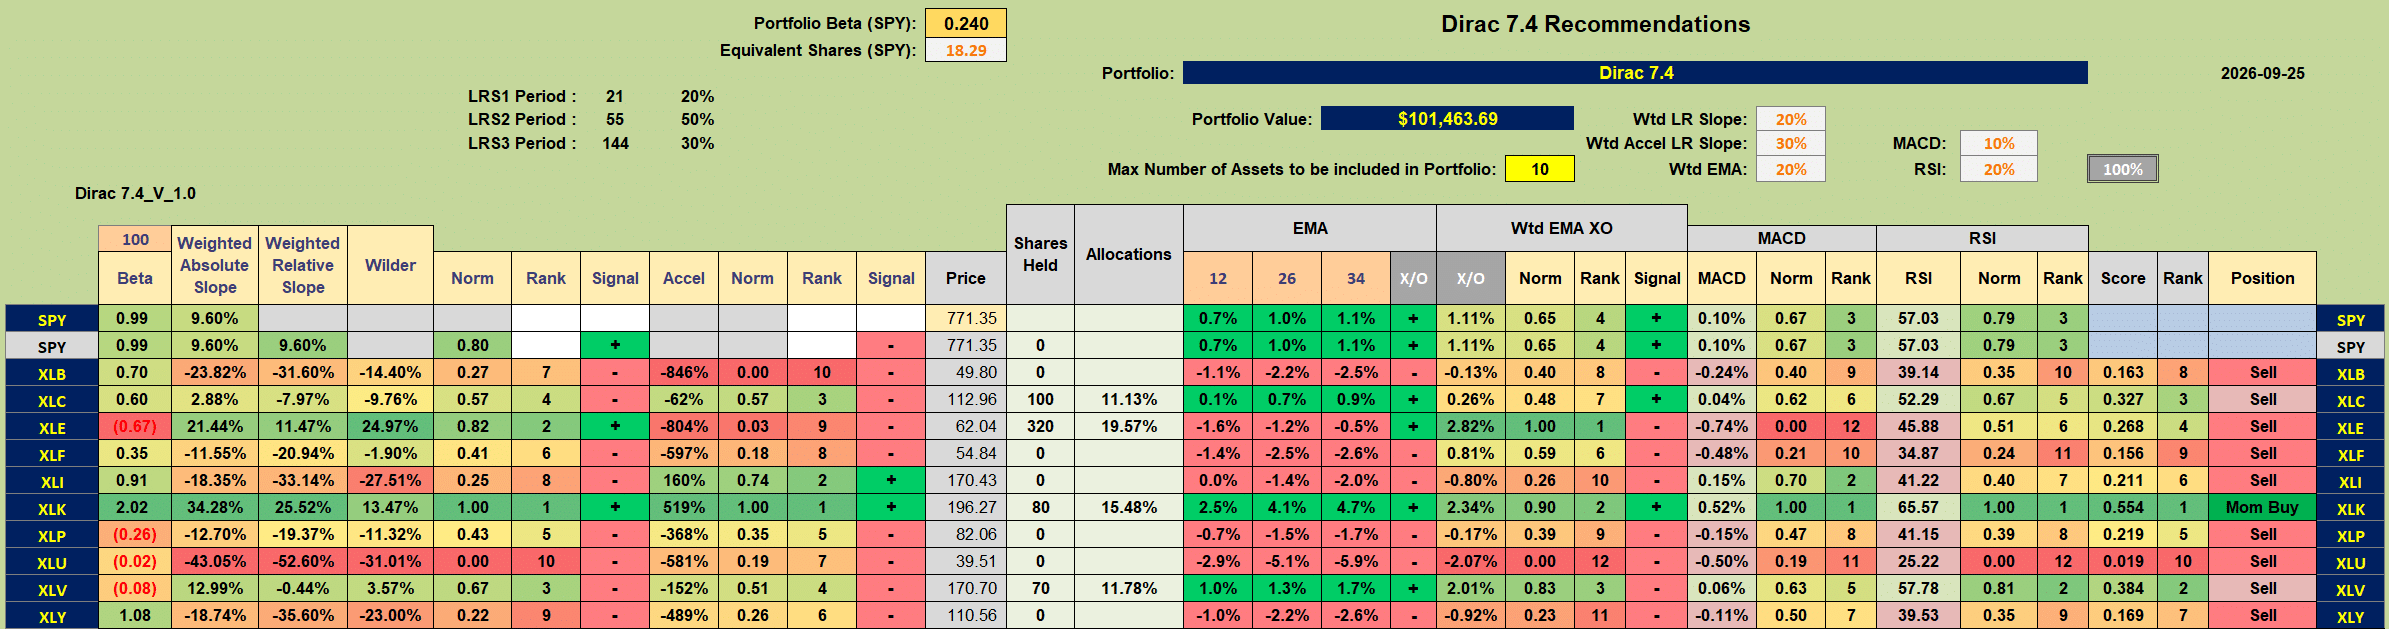 This is only showing a Buy recommendation for XLK, although the pale red/pink backgrounds for XLC and XLV reflect the fact that short-term indicators like MACD and RSI are still in positive territory. This is always where I check the price charts for confirmatory evidence – so, let’s take a look at some of these. First, XLF that I sold out of earlier in the month when the momentum/acceleration charts were looking like this:
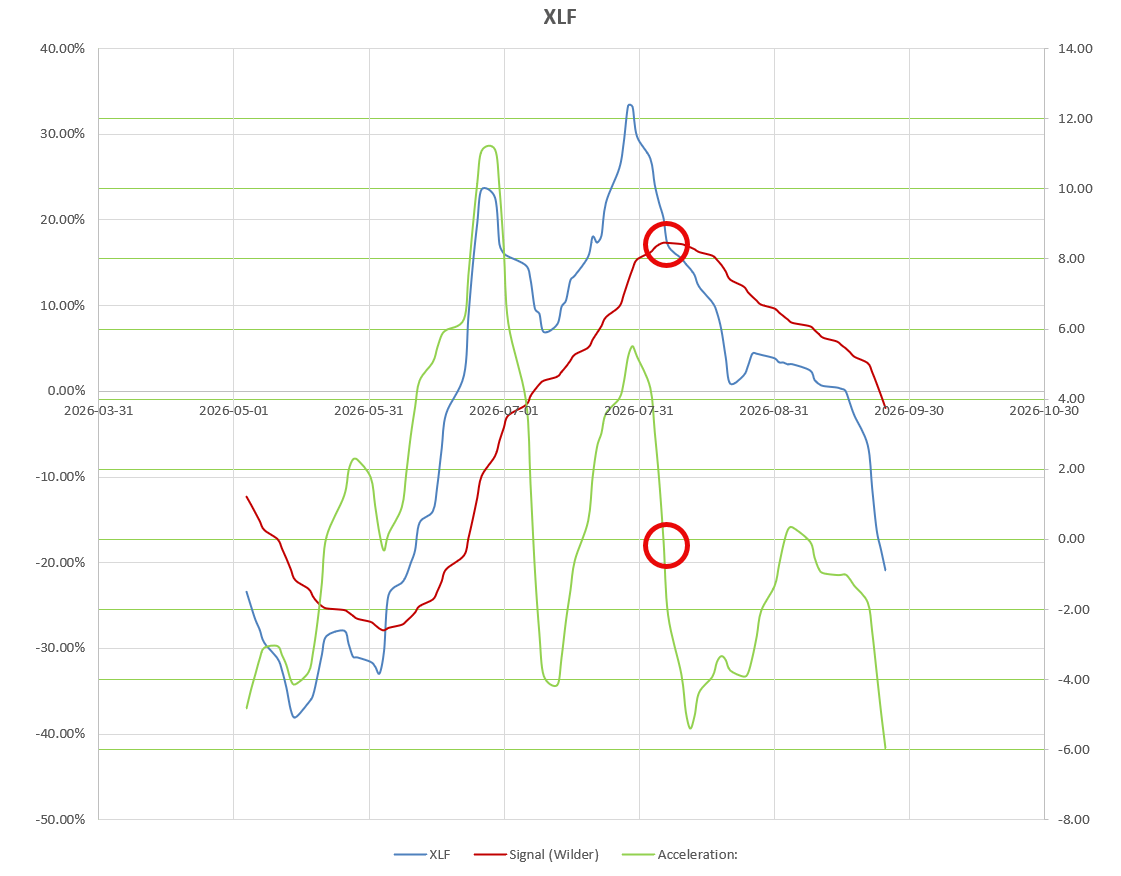 with both momentum and acceleration heading strongly into negative territory.
The price chart for XLF looks like this:
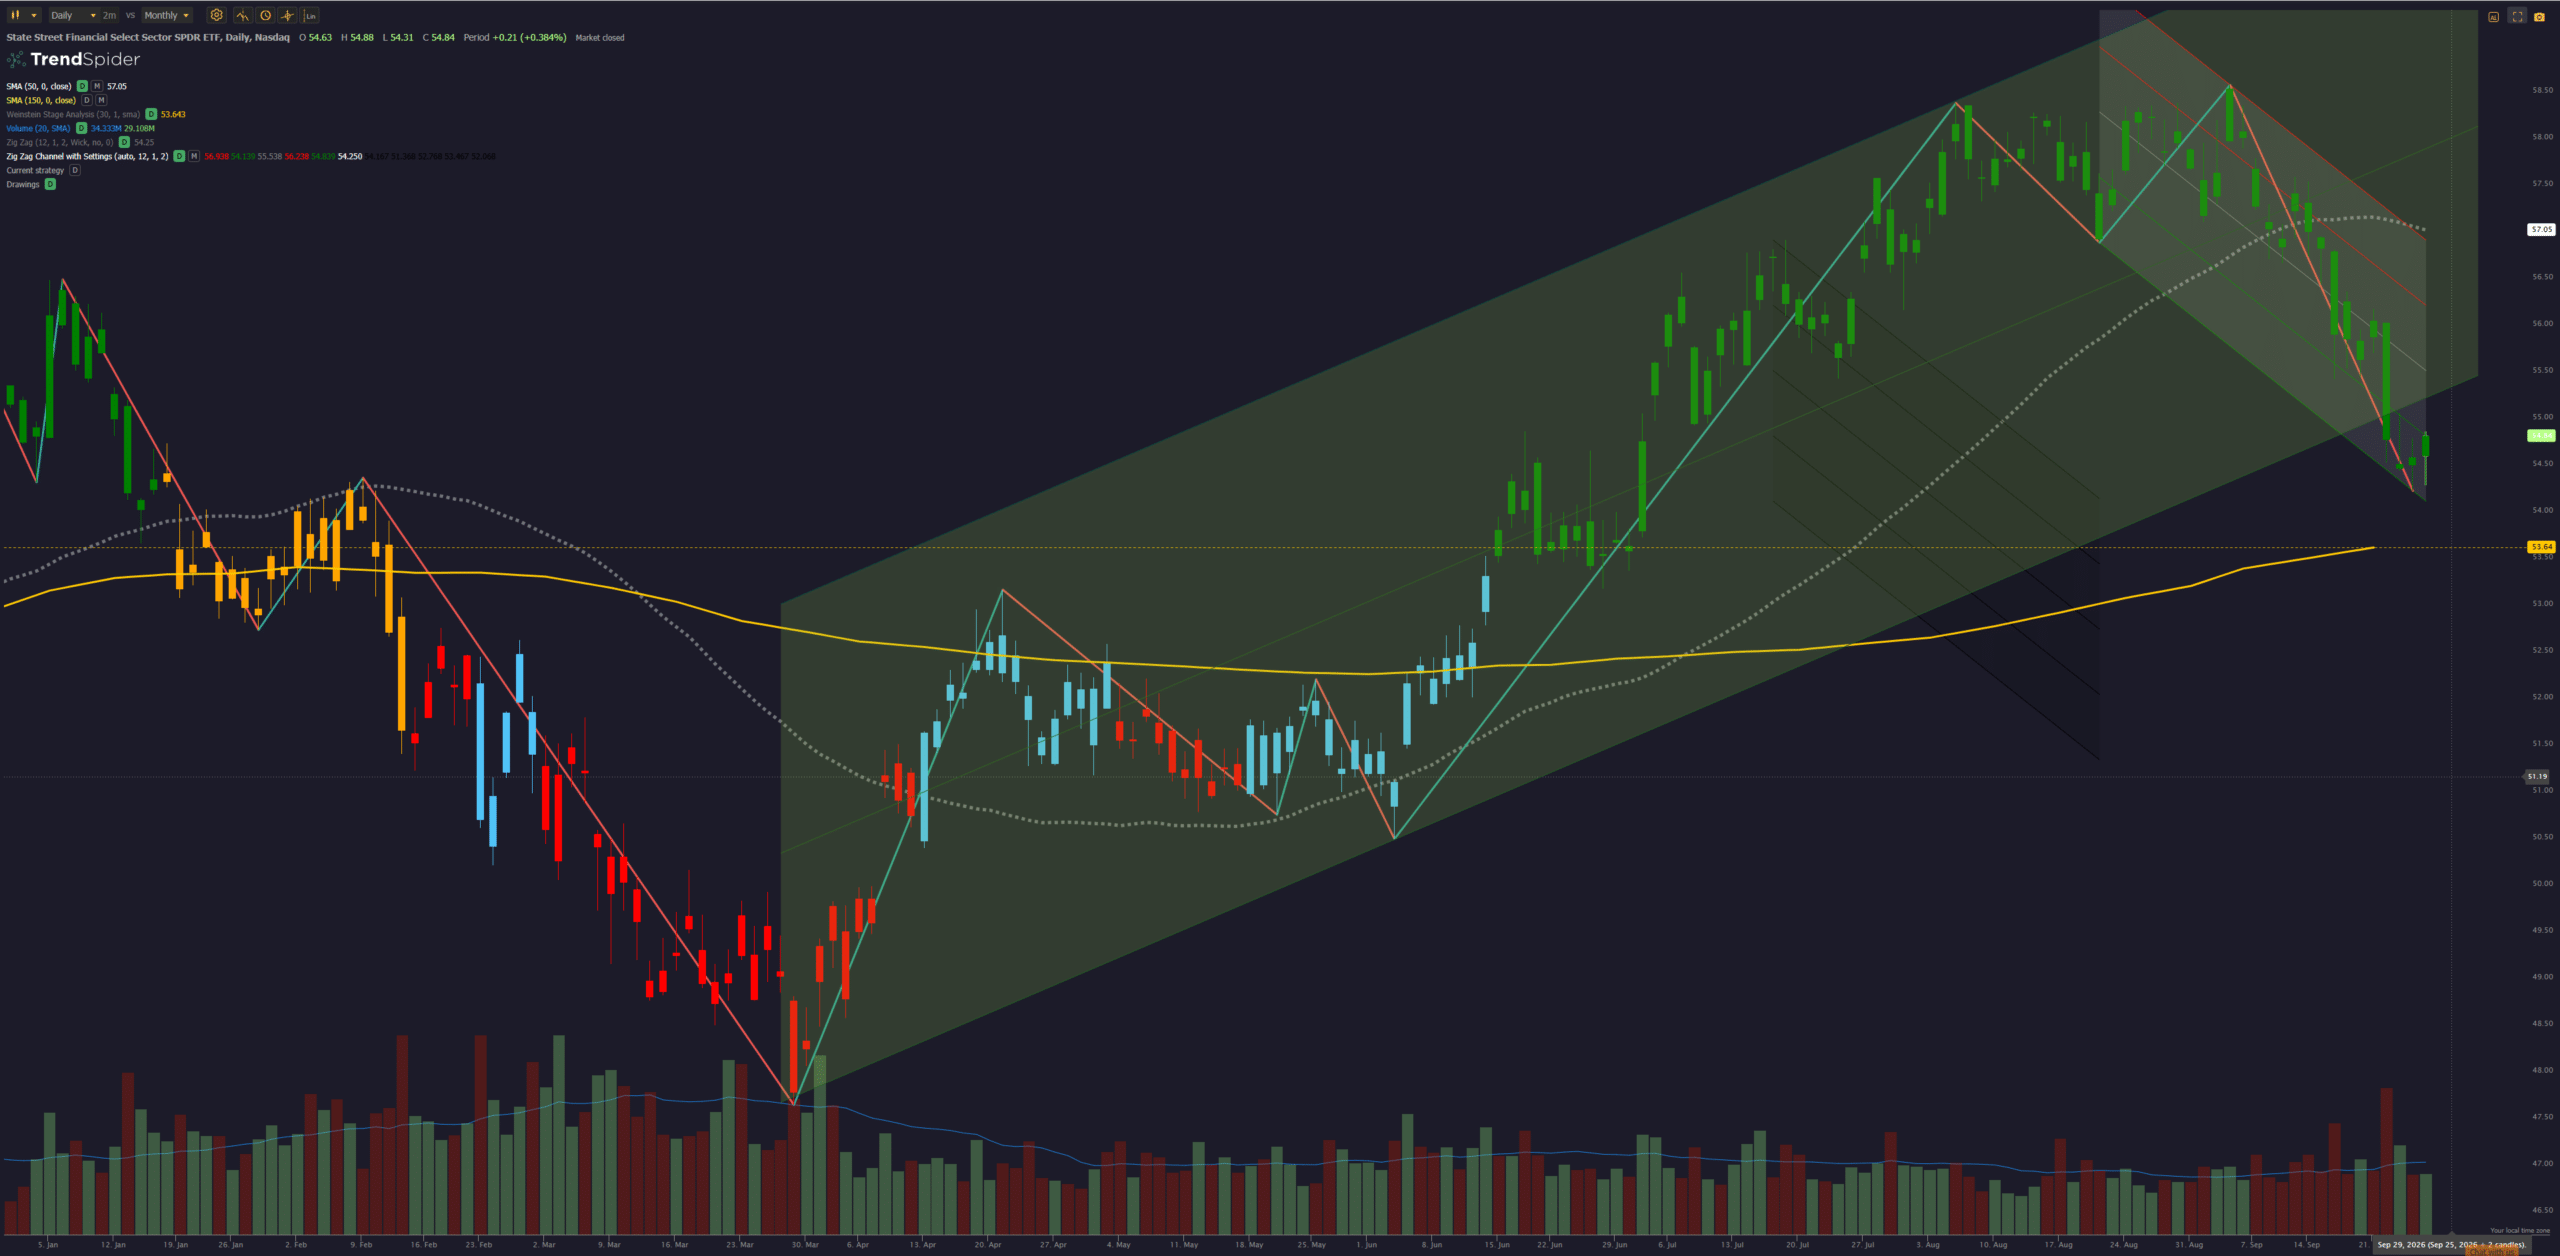 where we see that, after breaking out of a Stage 1 consolidation range (light blue candles) in mid June, XLF moved into a bullish uptrend channel (green candles) and currently sits at the bottom boundary of this channel and approaching the 200-day Simple Moving Average (SMA). I sold at about the time price hit the 50-day SMA as it pulled back from the highs. It seems likely that the candles will probably turn yellow should the pullback continue and this would signal a move into the Weinstein Stage 3 category and a confirmatory Sell signal. [The Weinstein Stage categorization is outlined in my recent Darwin Review Post at https://itawealth.com/darwin-portfolio-review-22-september-2026/.] At this point it is difficult to know whether the 9 September exit was the best decision or not – but it locked in a nice profit and re-entry on a bounce from here is always an option – whether this would result in a whipsaw trade is the only question.
The chart for XLC (Communications) looks like this:
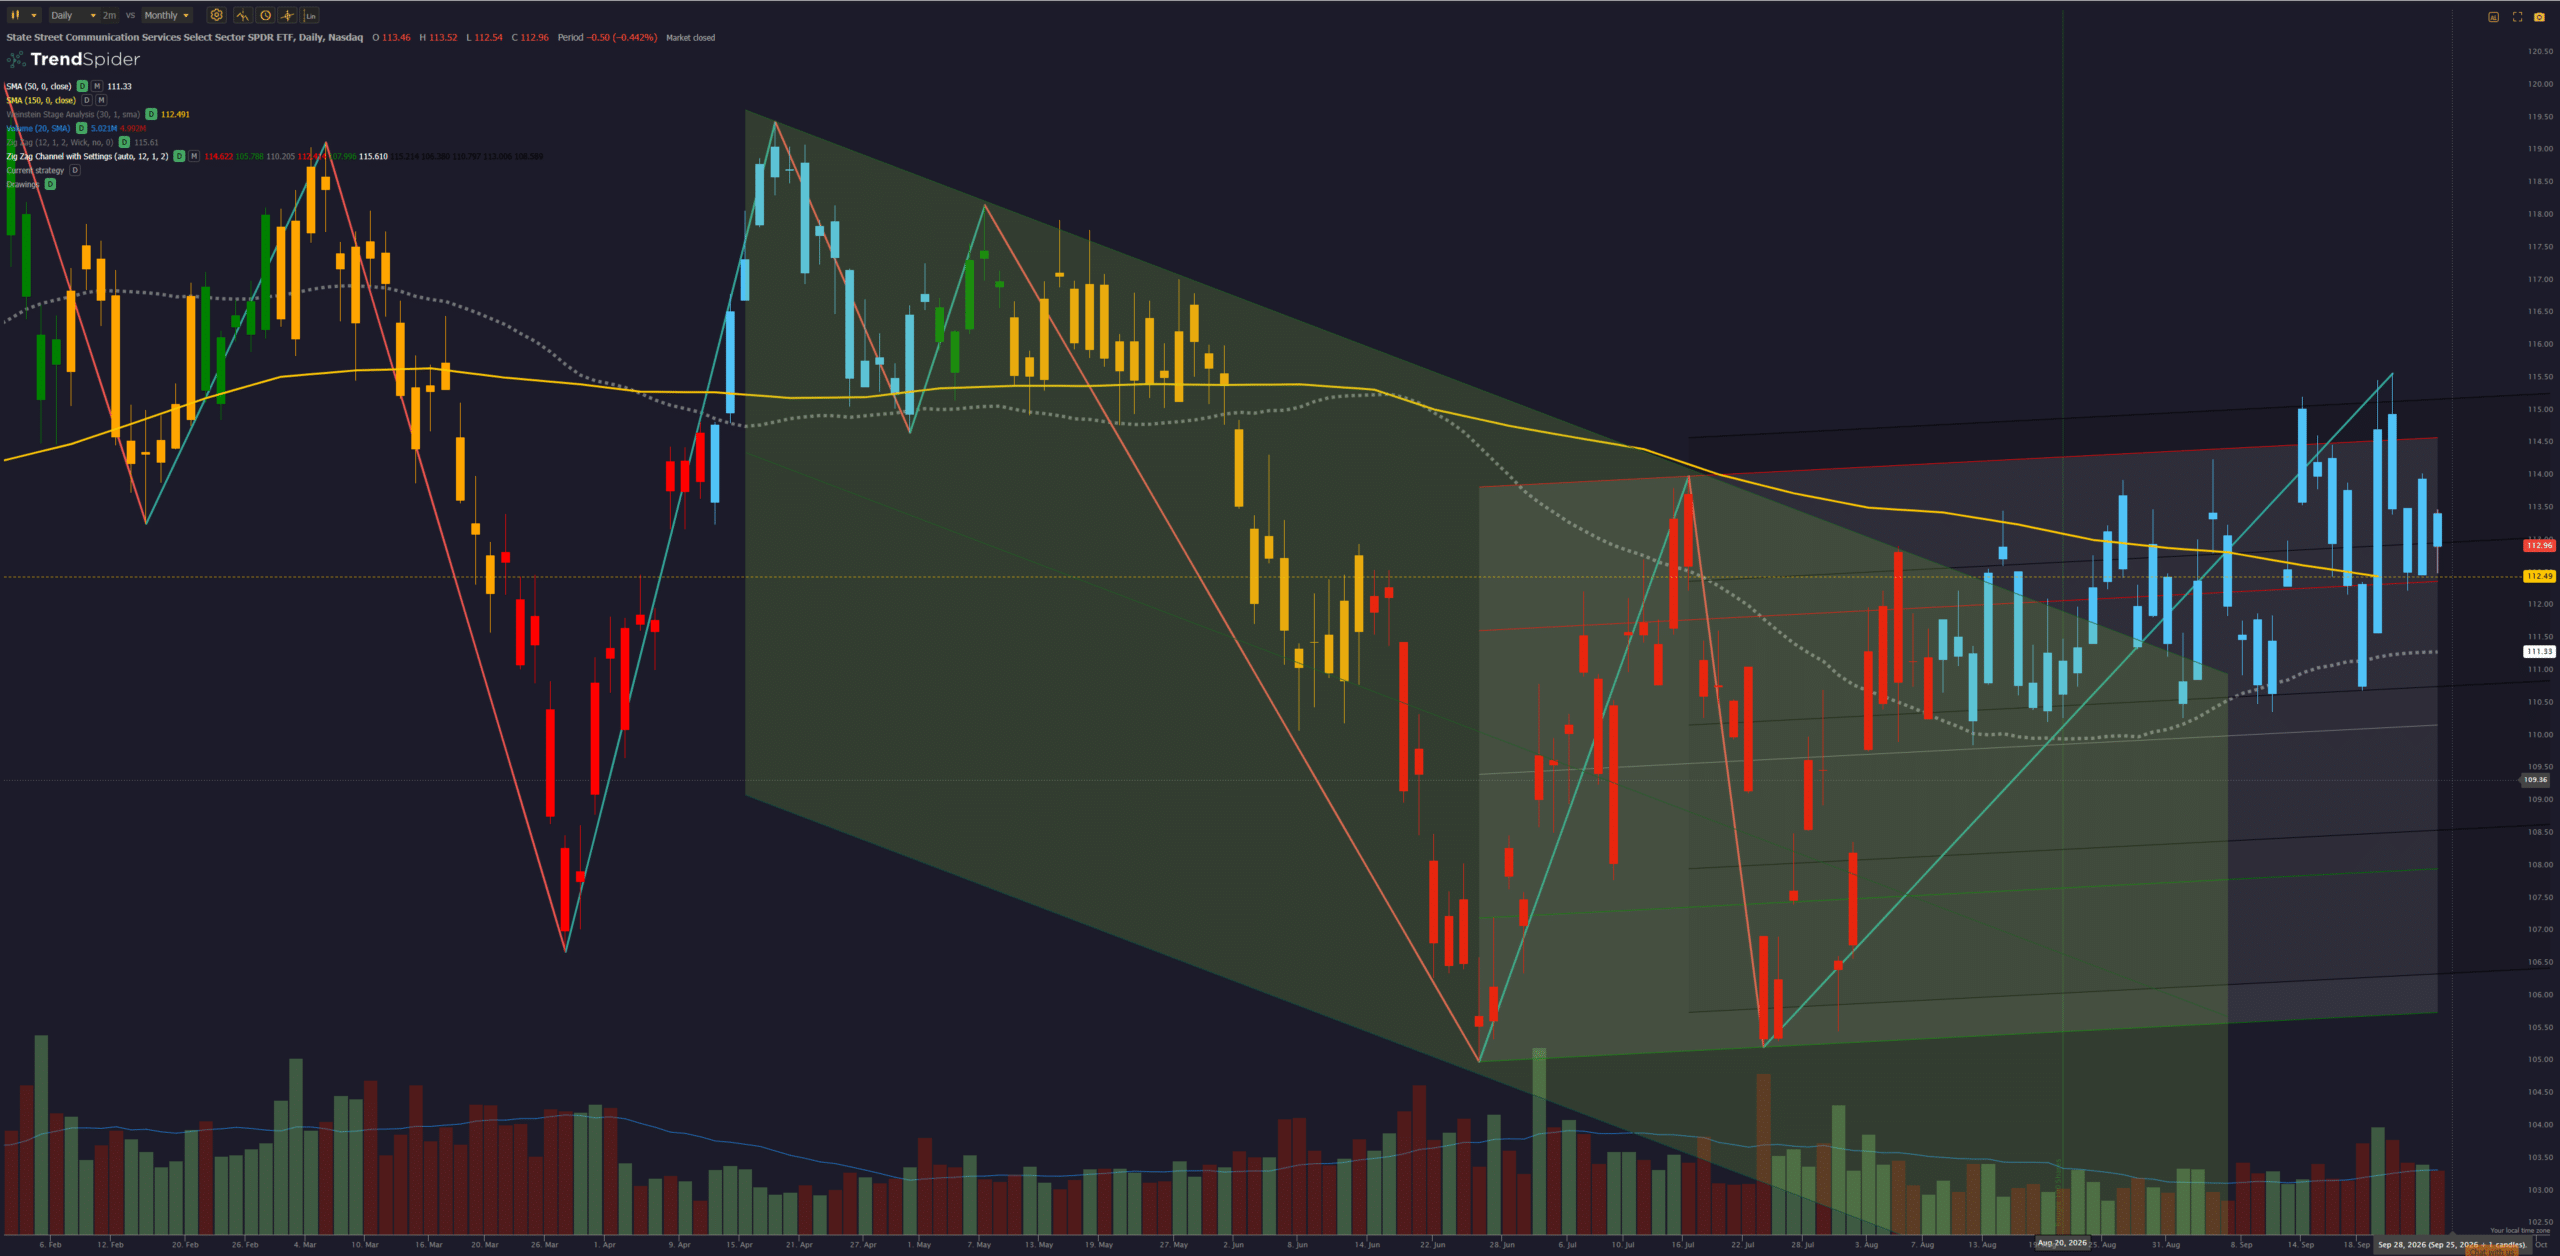 that shows consolidation in the Weinstein Stage 1 zone and awaiting a bullish breakout into Stage 2. I am only holding a half size position in XLC until the confirmation is confirmed.
XLE (Energy) looks like this:
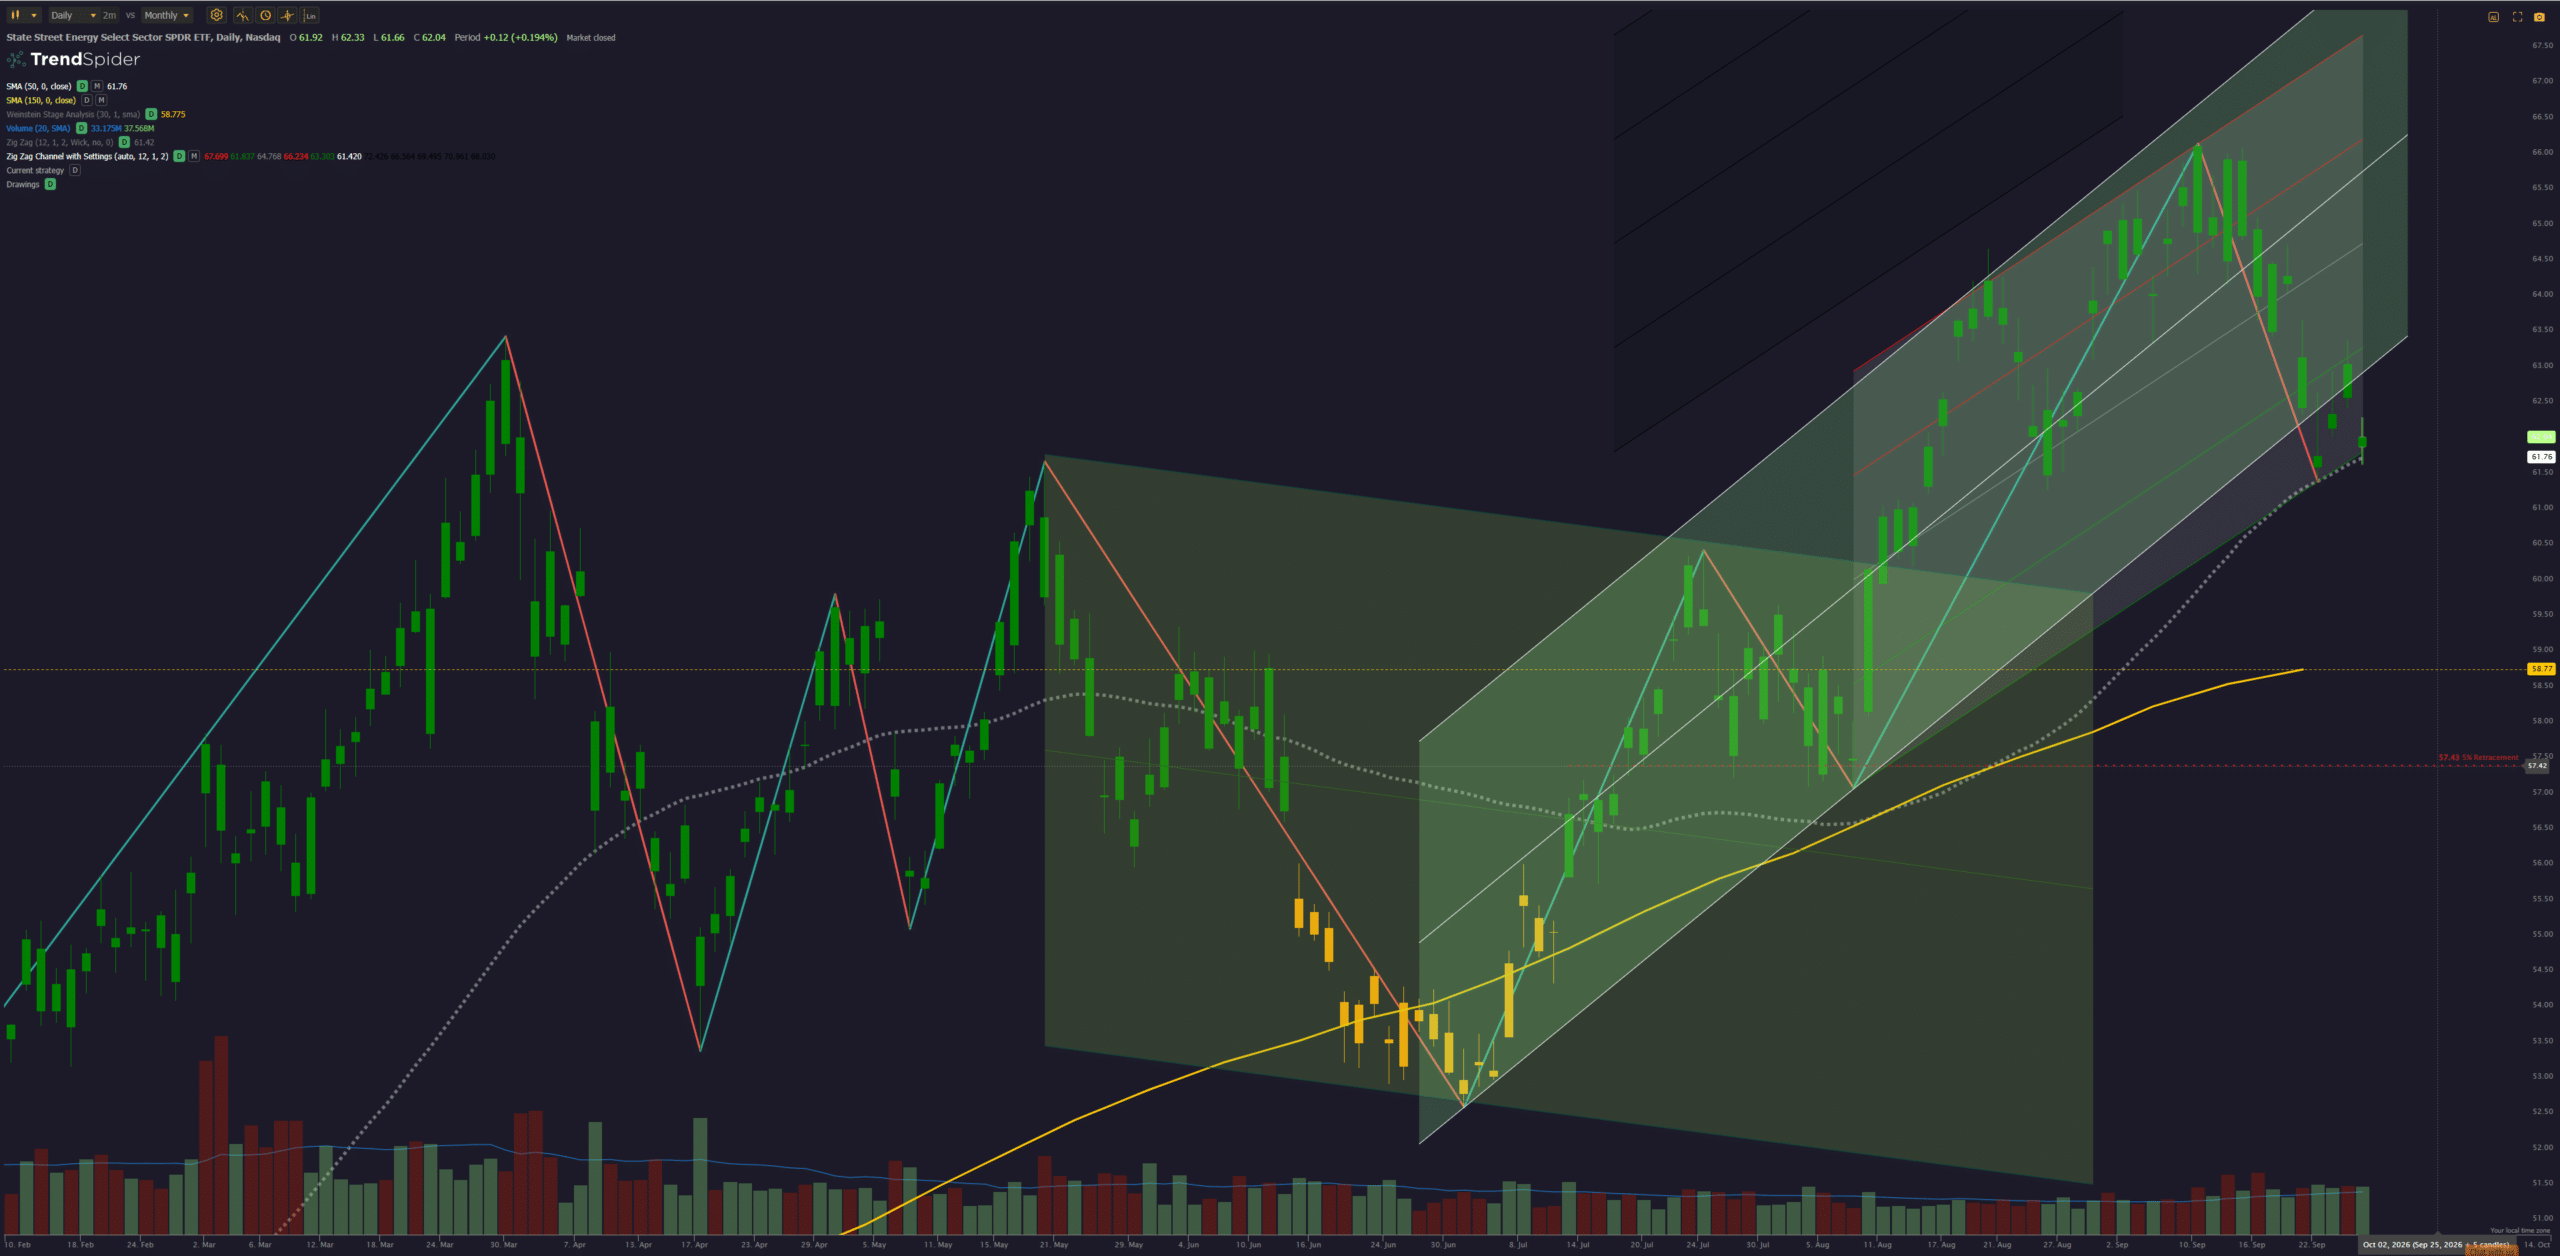 again, with a recent pullback to the bottom of the bullish channel and the 50-day SMA. However the green candles again show XLE to be in Weinstein Stage 2 territory – hence my decision to try to take advantage of the pullback and add to my existing position and to a full size allocation.
XLV (Health) Looks like this:
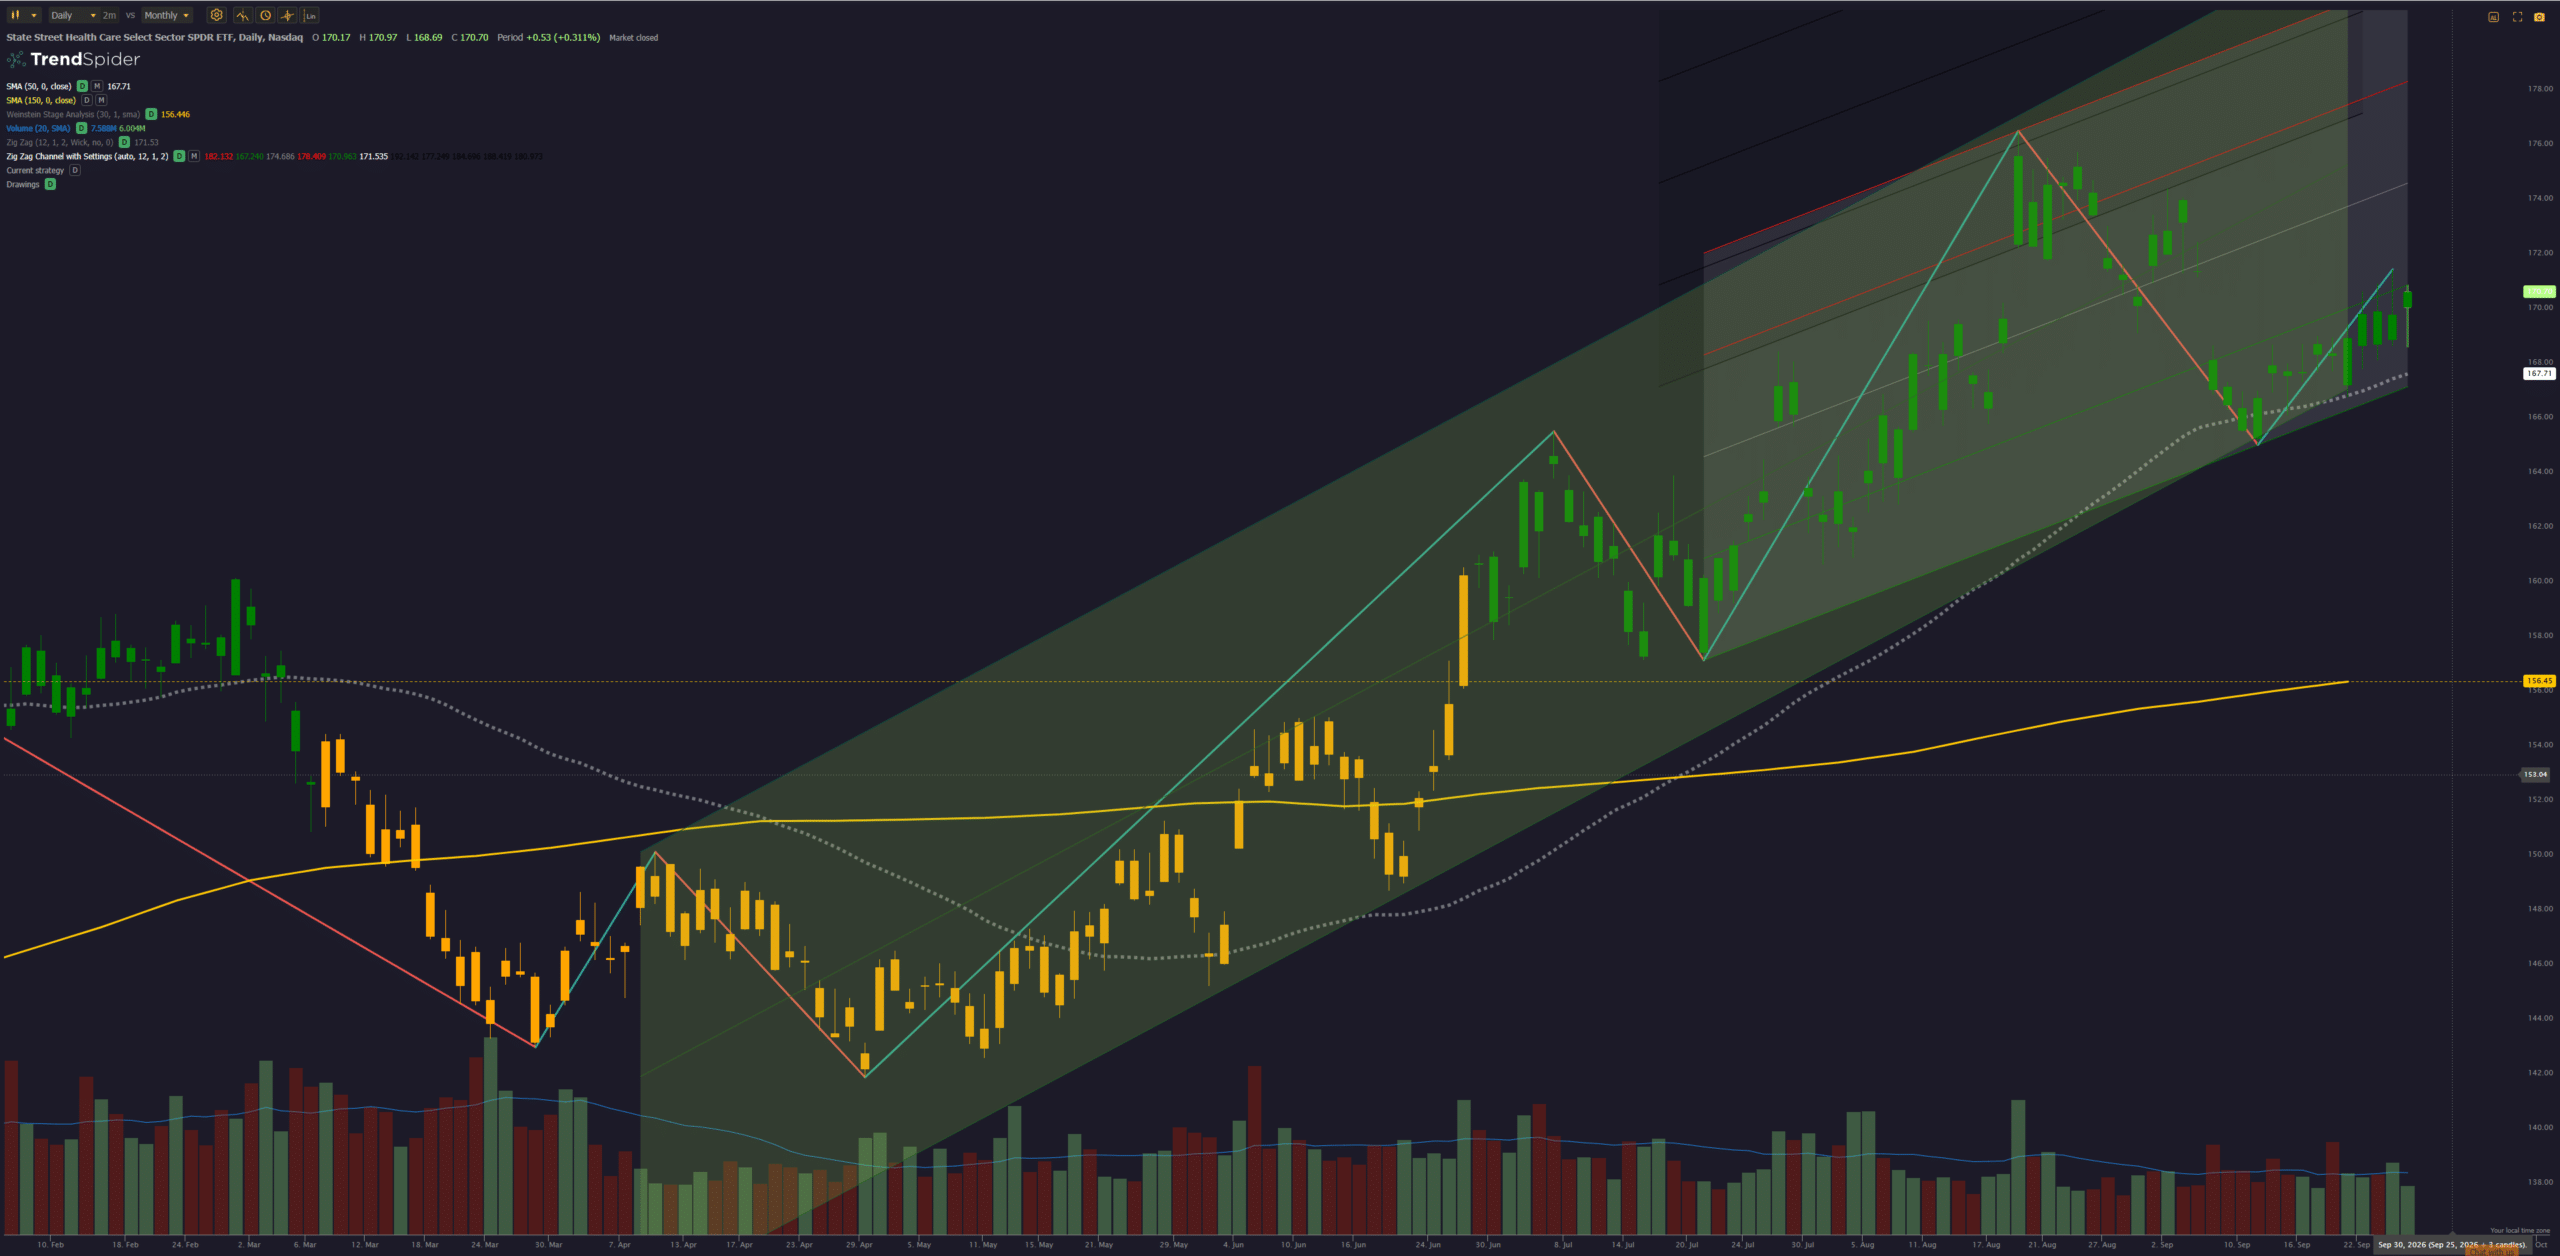 again at the bottom of the bullish uptrend channel and in Weinstein Stage 2 – and I am holding a half position in XLV.
Finally, XLK (Technology) looks like this:
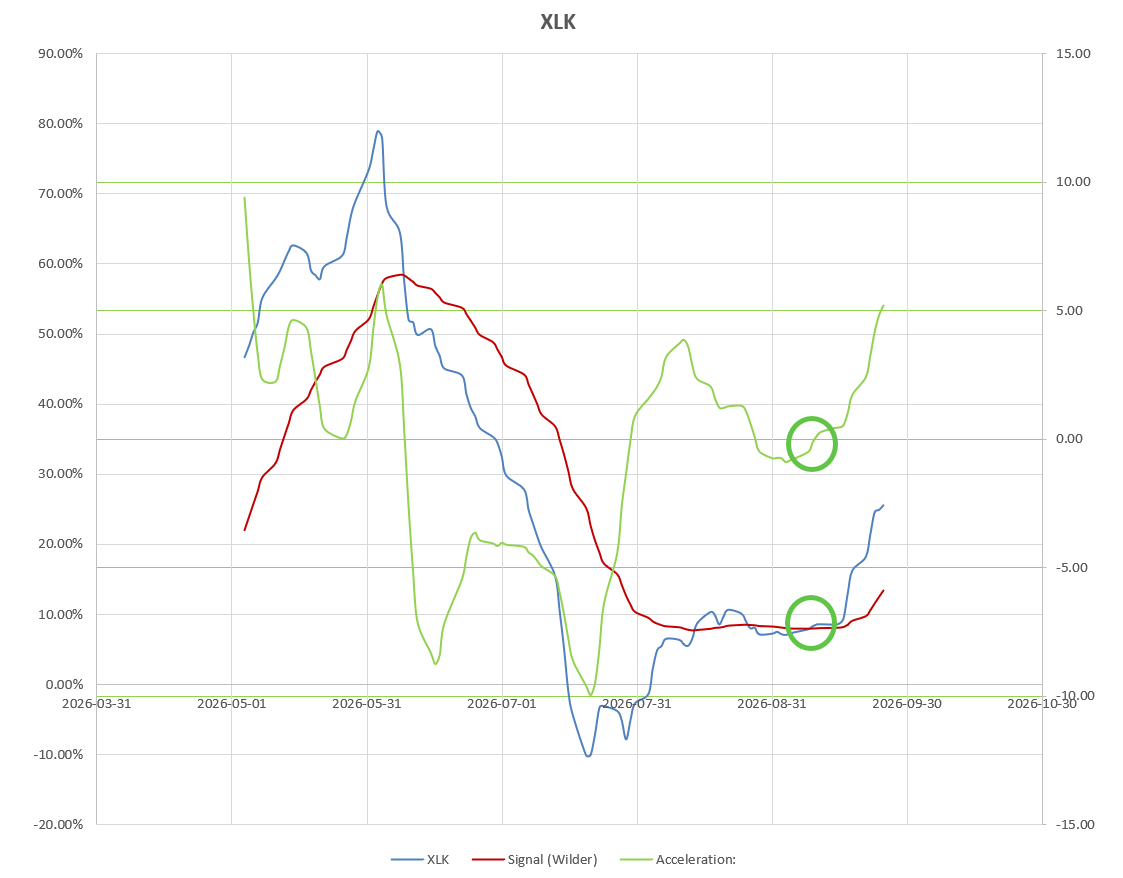
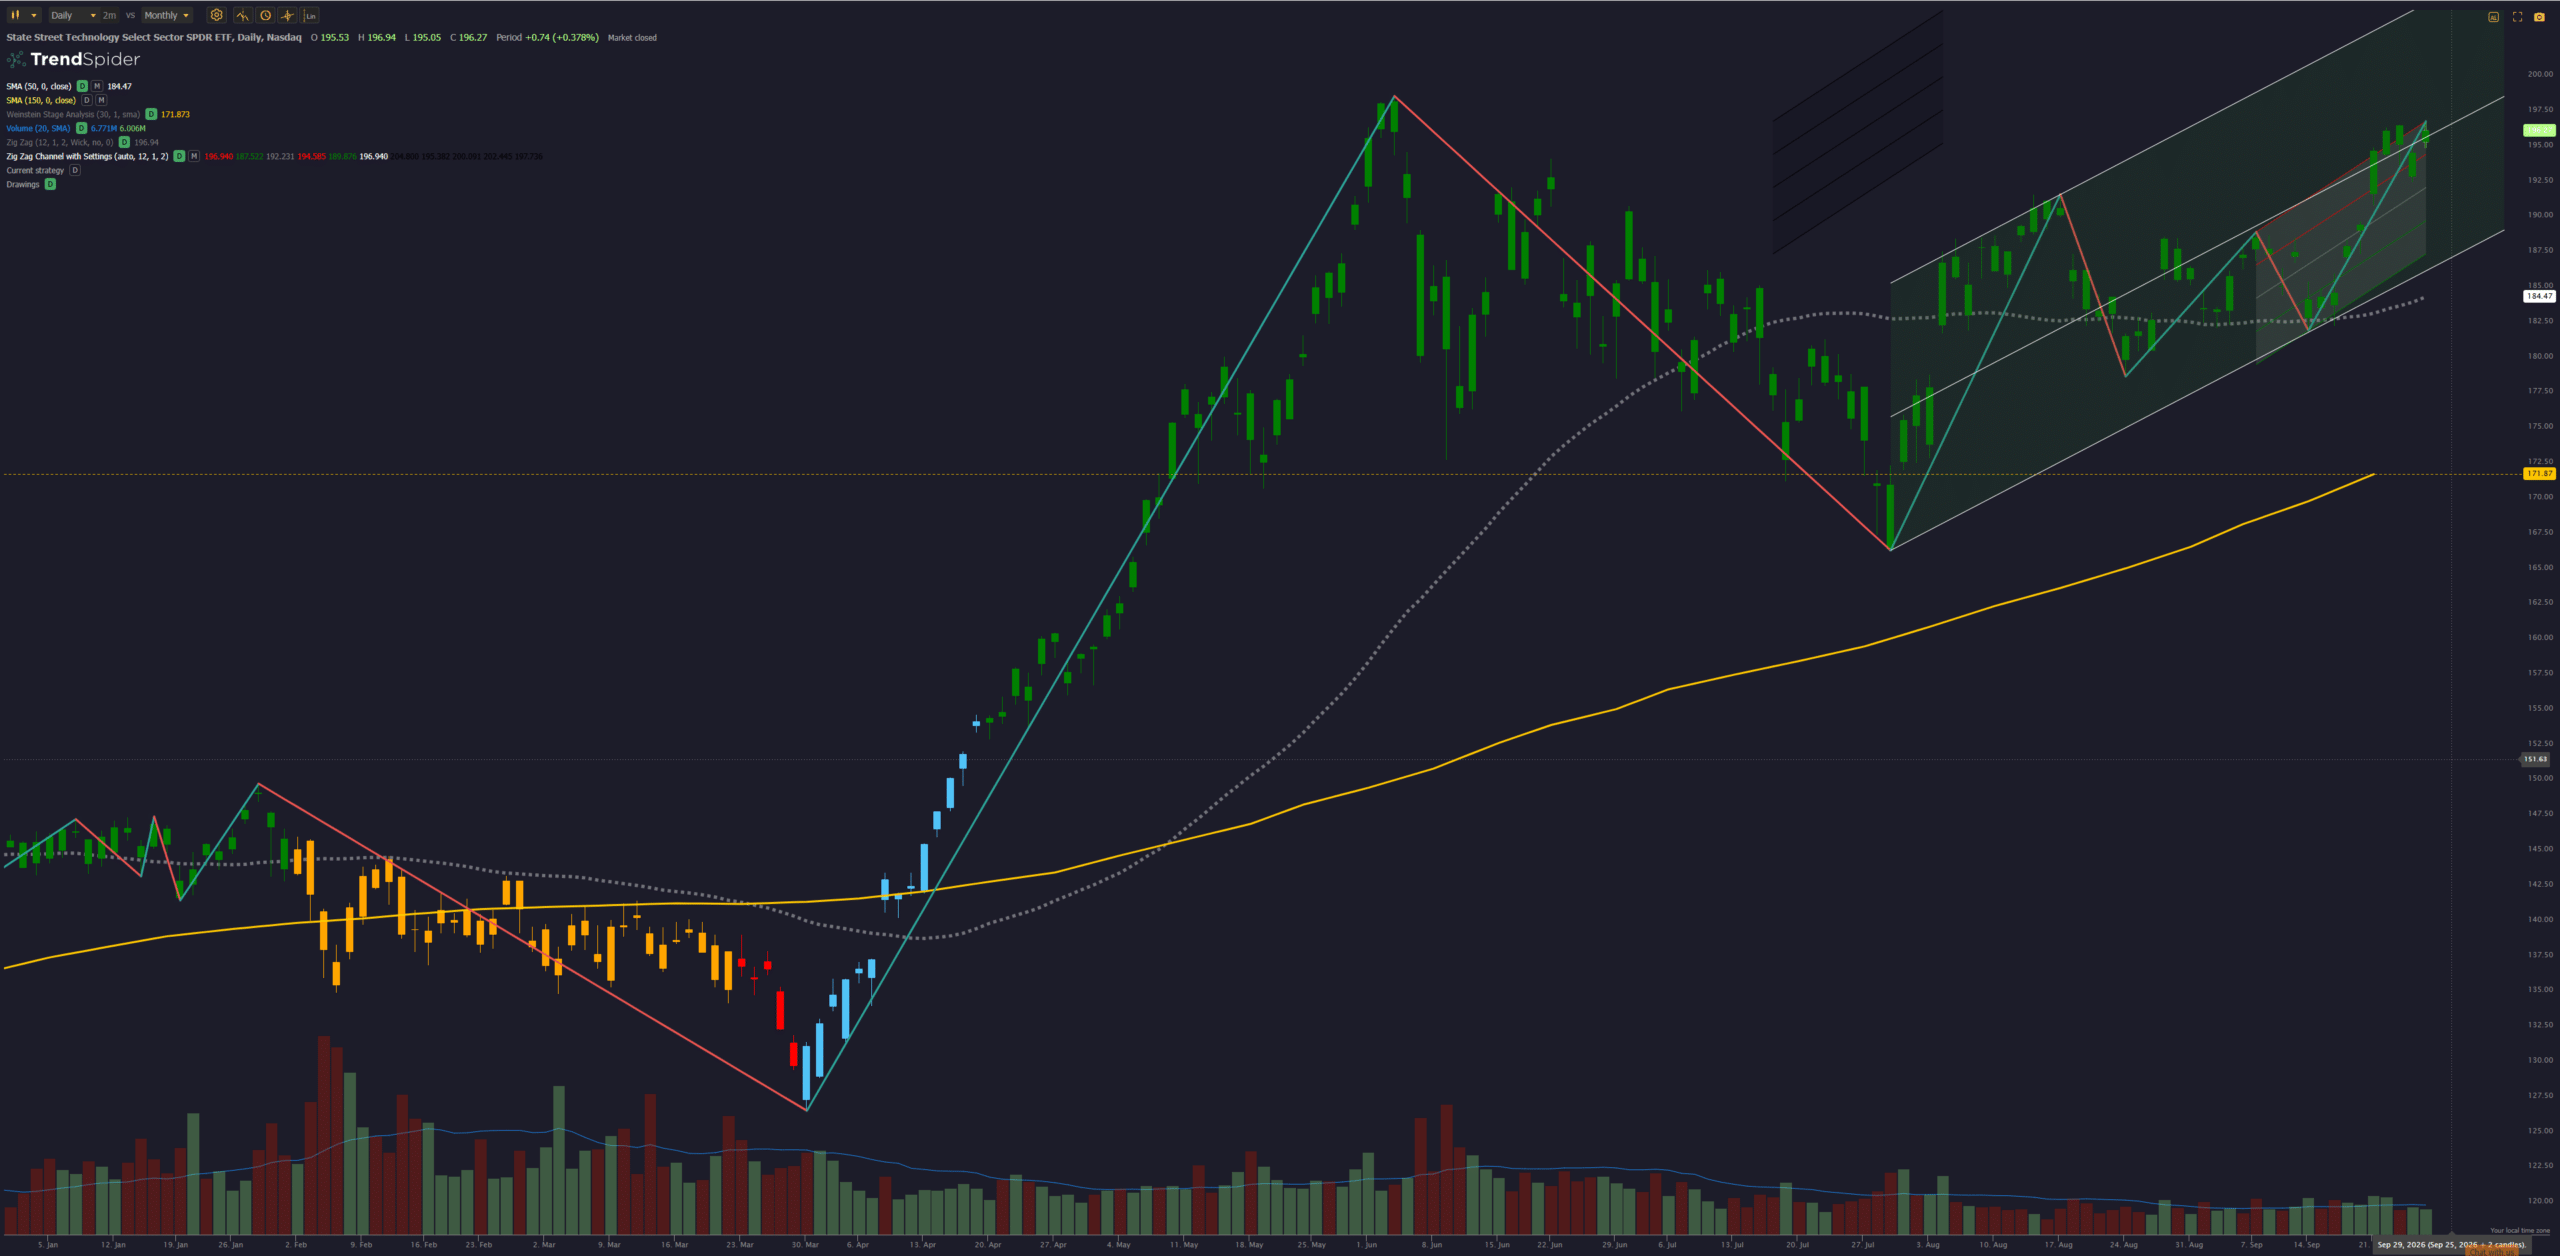 and, although I am a little late to the party (see momentum/acceleration graphs below), I’ve chosen to add a 3/4 size allocation to this ETF as it leads the SPX Index recently and has been strong throughout the year:
 Relative Sector performance looks like this:
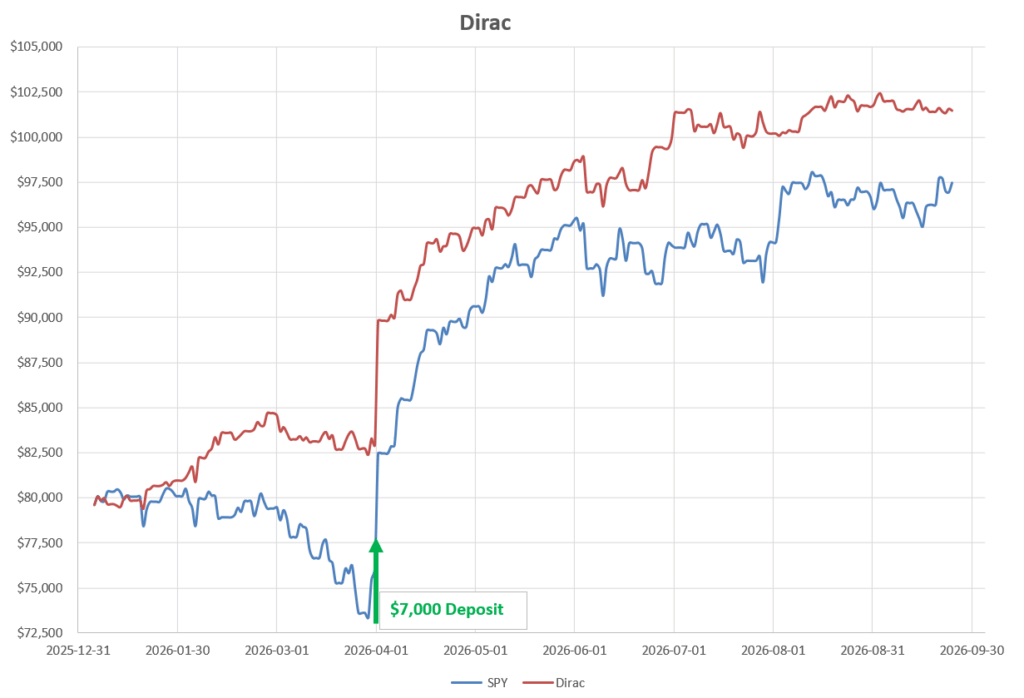
 Finally, there has been relatively little movement in this portfolio (or the benchmark AOA Fund) over the past two months and performance looks like this:
Discover more from ITA Wealth Management
Subscribe to get the latest posts sent to your email.
Leave a Comment or Question