
Juniper bonsai starter.
Pauling is the first of five portfolios to be reviewed this week. We have several asset allocation models and one Sector BPI portfolio to update. This week will provide readers with several different investing models to examine and evaluate.
Pauling Asset Allocation
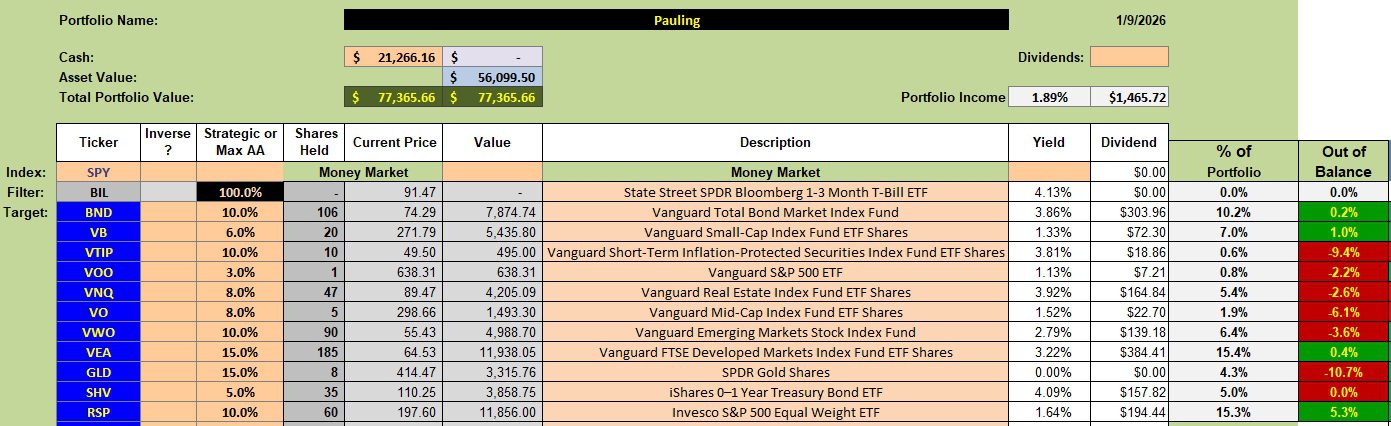
Below is the current Pauling asset allocation setup. While there is excess cash, limit orders are set for a number of asset classes currently out of balance. More on this below as I lay out where the cash is to be used.
Pauling Rebalancing Recommendations
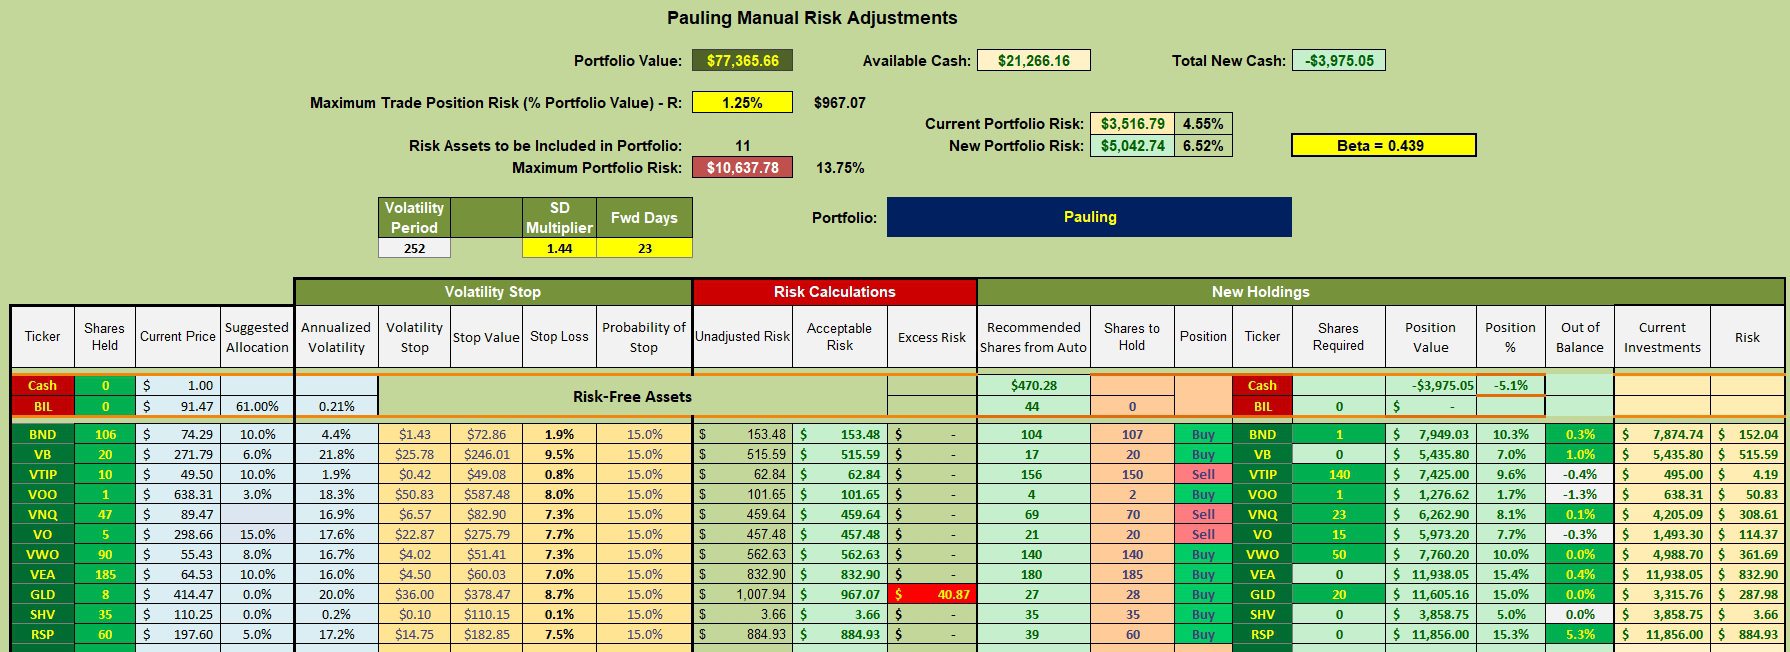
Limit orders are in place to bring asset classes back into balance. I had hoped to have all this accomplished back in December, but this is one portfolio that needed more attention and is still not finished. The goal is to minimize trading in 2026 in order to reduce the tax burden.
The 6th column from the right indicate what limit orders are in place and for which asset classes.
Pauling Performance Data
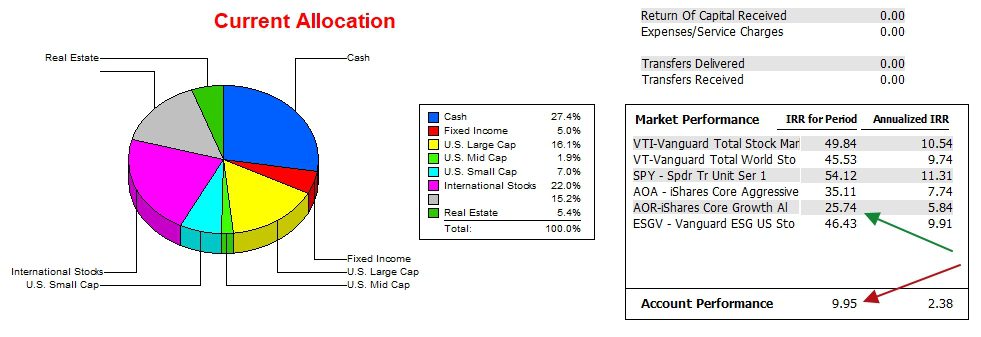
Since 12/31/2021 the Pauling has lagged the AOR benchmark by a significant percentage. Diversifying away from mega-cap stocks has hurt performance, but may serve the portfolio well in the future, if and when we have a major correction. A correct is coming. It is just a matter of when.
Pauling Risk Ratios
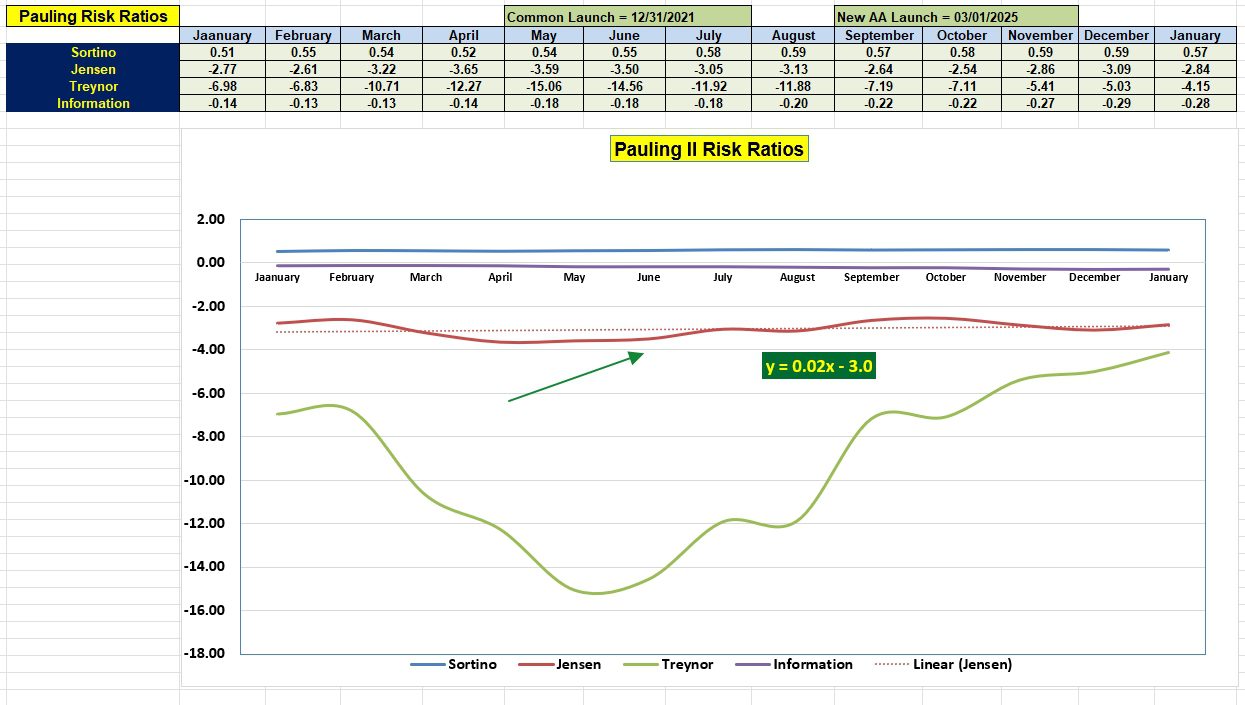
Here is my take on the four risk measurements, based on their importance.
- By far the most important risk measurement is the Jensen Alpha or Jensen Performance Index. While it is slightly lower than it was back in January of 2025 we see a slight improvement over the past few months. Also, the slope (+0.02) is now positive.
- The second most important measurement is the Information Ratio. While there is slight improvement since December, overall the performance has slipped. This indicates the portfolio is not keeping pace with the benchmark.
- Next in importance is the Sortino Ratio. The value has been rather dormant over the past year. Modest improvement since last summer indicated the portfolio is growing slightly in value.
- Least important is the Treynor Ratio. Improvement in this ratio is due in large part to reducing the portfolio beta. In other words, the portfolio is much less risky than it was some months ago. Shifting toward a more conservative portfolio is having a positive impact on the Treynor metric.
Questions and Comments are always welcome.
Discover more from ITA Wealth Management
Subscribe to get the latest posts sent to your email.
Leave a Comment or Question